


Gold and Silver Price Analysis and Charts.
- Gold’s recent pull-back has come to a halt ahead of a week packed full of risk events.
- Silver caught between trend and 200-day moving average.
DailyFX Q2 Forecasts and Top 2019 Trading Opportunities.
Gold Fades Lower but Risk Lies Ahead
Gold sits just above an important support zone as it tries to keep gains made last week. While the short-term chart pattern remains bearish, with lower highs and lower lows seen since February 20, the week is full of high-risk events and data releases which may help to underpin gold at its current levels.
Gold Price Outlook: A Week Packed Full of Major Risk Events and Data
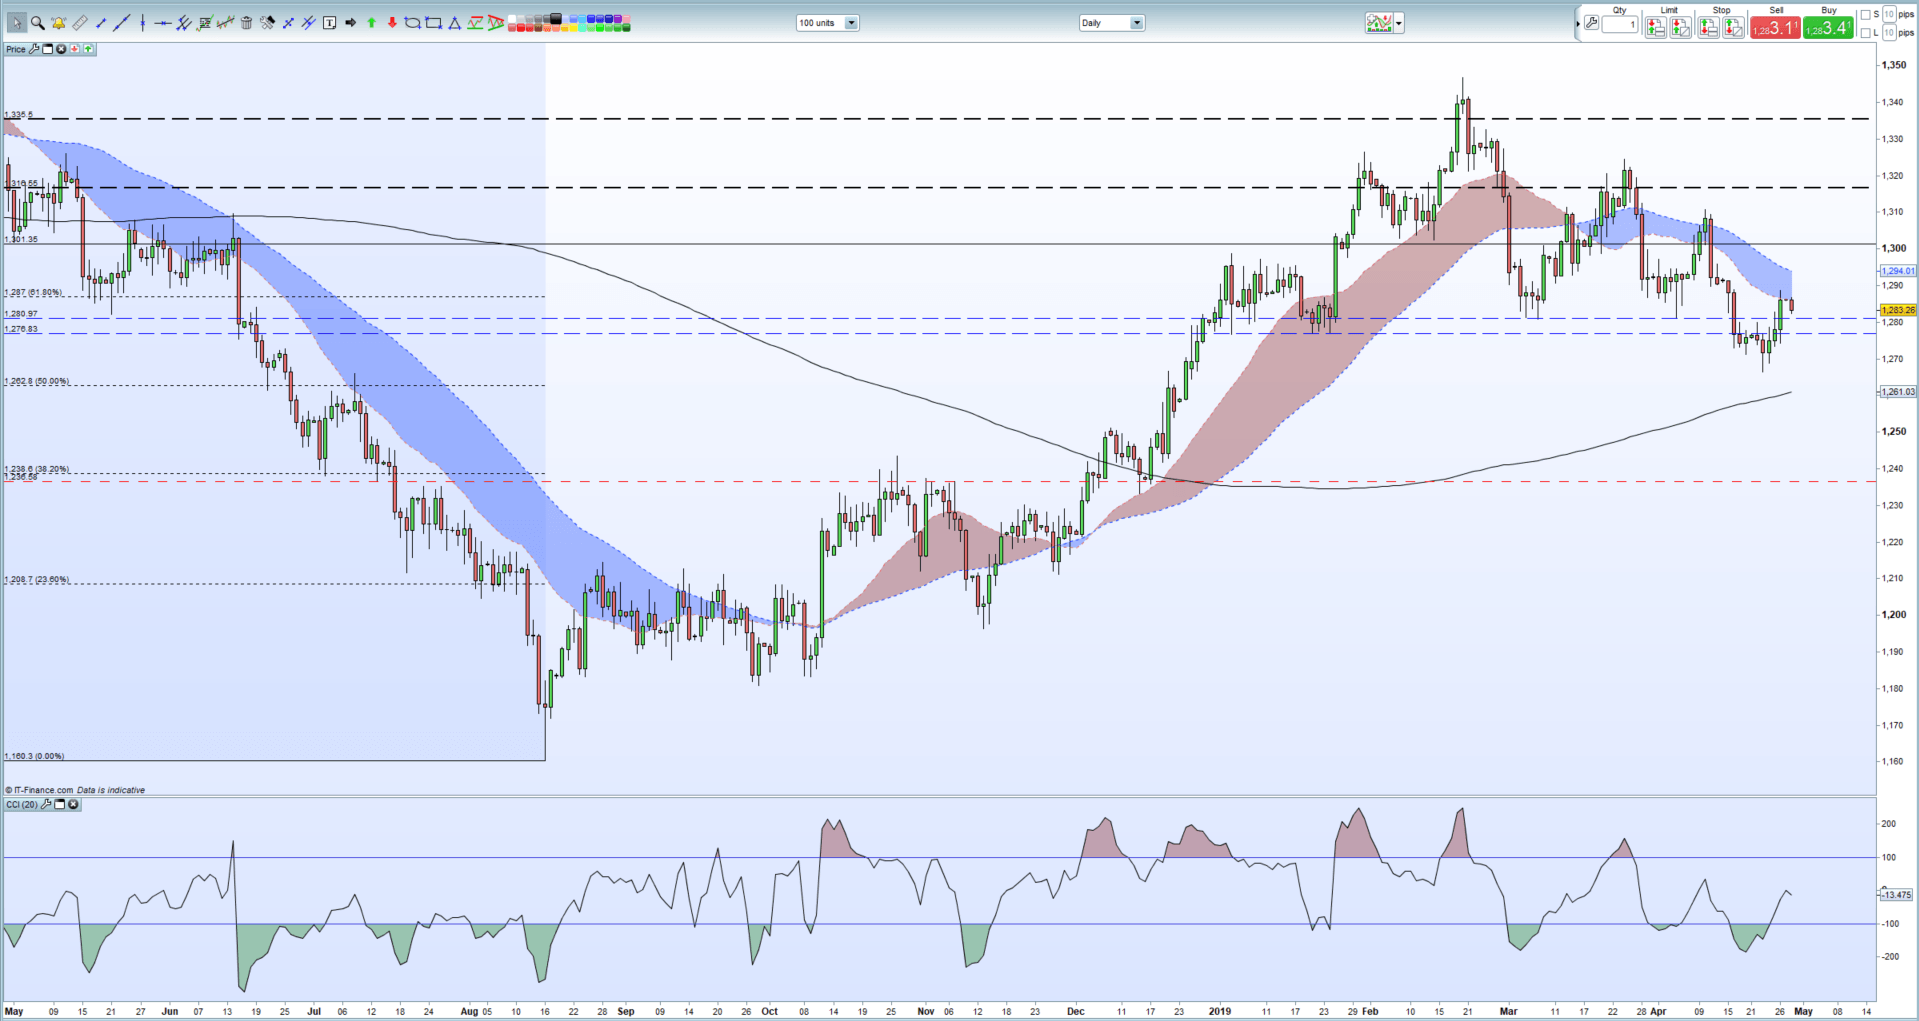
The daily chart shows gold nearing the $1,276 - $1,281/oz zone that acted as minor resistance last week. The upper band of this zone should now act as first, minor, support before $1,276/oz and $1,266/oz come into play. To the upside, 61.8% Fibonacci retracement at $1,287/oz is the first target for bullish traders followed shortly after by $1,289/oz. The CCI indicator shows gold mid-market, neither overbought or oversold.
Gold Daily Price Chart (May 2018 – April 29, 2019)
Trading the Gold-Silver Ratio: Strategies and Tips.
IG Client Sentiment shows that retail traders are 73.0% net-long gold, a bearish contrarian indicator. However, recent daily and weekly sentiment shifts suggest that the current gold trend may reverse higher.
Silver – 200-DMA Battles Bearish Bias.
Silver remains just above $15.03/oz with minor support seen at the physiological $15.00/oz before slightly more meaningful support from the 200-day moving average, currently at $14.97/oz. The longer-dated ma has provoked supportive price in the last month and may turn to resistance if a fresh break and close below occurs. Below here 23.6% Fibonacci retracement at $14.91/oz. Silver has broken – is currently trading above – the downtrend line based off the February 20 high, and a clean break and close above may bring open the way to $15.09 - $15.11/oz in the short-term. The last swing high at $15.34/oz remains the next target.
How to Trade Silver: Top Silver Trading Strategies.
Silver Daily Price Chart (August 2018 – April 29, 2019)

IG Client Sentiment shows how retail traders are positioned in a wide range of currencies, commodities and cryptocurrencies. See how recent changes in positioning affect our trading bias.
--- Written by Nick Cawley, Market Analyst
To contact Nick, email him at nicholas.cawley@ig.com
Follow Nick on Twitter @nickcawley1


