


4Q 2018 US HOUSEHOLD NET WORTH – TALKING POINTS
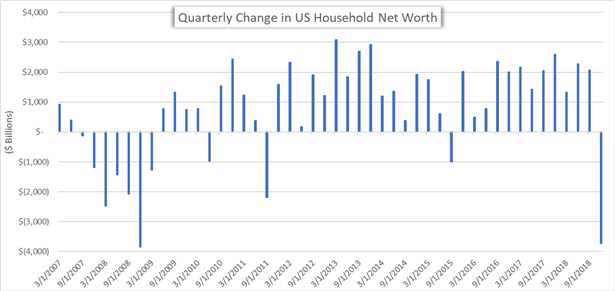
- Household Net Worth in the US for 4Q fell to $104 Trillion from $108 Trillion in the period prior
- A widespread selloff in risk assets at the end of 2018 sent stock prices tumbling lower and labeled as the primary contributor to the 3.5 percent decline in US household wealth
- Check out the free DailyFX Building Confidence in Trading Guide for tips on how to sharpen your trading skills!
Household wealth in the United States dipped by 3.5 percent, a decline of $3.7 Trillion, over 4Q 2018 driven primarily by a cratering stock market. US Household Net Worth of $104.3 Trillion at the end of year compares to third quarter’s reading of $108 Trillion. The report for the current period showed the largest drop in household wealth since the Great Financial Crisis.
US HOUSEHOLD NET WORTH PRICE CHART: QUARTERLY TIME FRAME (JANUARY 2007 TO DECEMBER 2018)
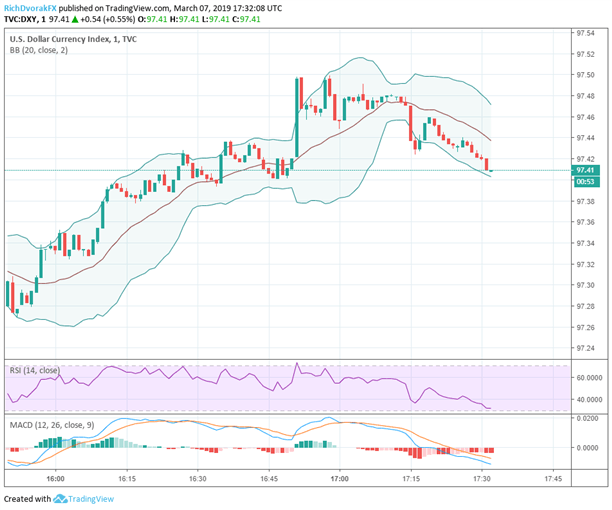
Immediately following the report, the US Dollar was little changed but upward momentum looks to fade following solid gains made earlier in today’s session.
DXY US DOLLAR INDEX CURRENCY PRICE CHART: 1-MINUTE TIME FRAME (MARCH 07, 2019 INTRADAY)
Unsure about the USD’s next direction? Download the free USD Forecast for comprehensive insight from DailyFX’s analyst on the currency’s outlook!
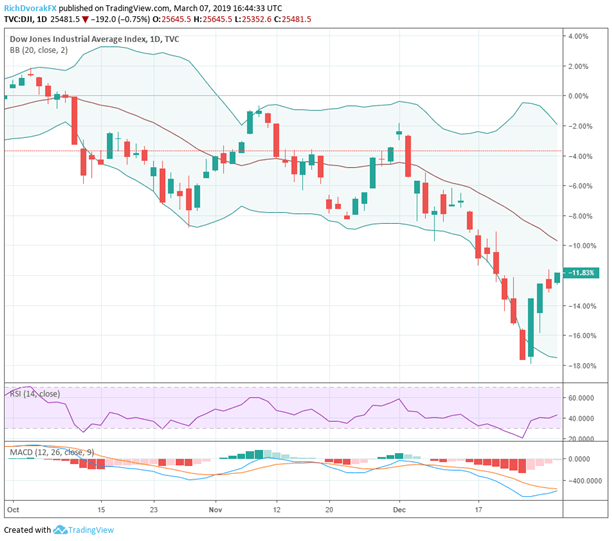
The $3.9 Trillion decline in financial assets over the months of October through December was widely attributable to the near 20 percent slide in US equity prices. Although, the decline was partially offset by a modest $300 Billion rise in the value of real estate.
DOW JONES INDUSTRIAL AVERAGE INDEX PRICE CHART: DAILY TIME FRAME (OCTOBER 01, 2018 TO DECEMBER 31, 2018)
The report also showed that domestic nonfinancial debt grew at a 2.7 percent seasonally adjusted annual rate which is lower than the 4.5 percent rate reported in 3Q 2018. However, household debt still climbed $241 Billion over the final quarter of the year. Also noteworthy from the release was the slide in the personal savings rate from 3.53 percent to 3.07 percent.
---
Written by Rich Dvorak, Junior Analyst for DailyFX
Follow on Twitter @RichDvorakFX
Check out our Education Center for more information on Currency Forecasts and Trading Guides.


