


Talking Points:
- Financial Assets grew 2.2 percent led by record high equity prices
- Household leverage increased modestly from expanding consumer credit
- US stock selloff subsides following the release
American households feel a little wealthier at the end of the third quarter as net worth increases over $2 Trillion from a net worth of $107 Trillion midyear. Total assets increased 1.8 percent to nearly $125 Trillion during the months of July through September led by a 2.2 percent gain in financial assets. Total liabilities increased also albeit a slower pace of 1.1 percent primarily due to expanding consumer credit.
SPX Price Chart (Daily Bars) Third Quarter 2018:
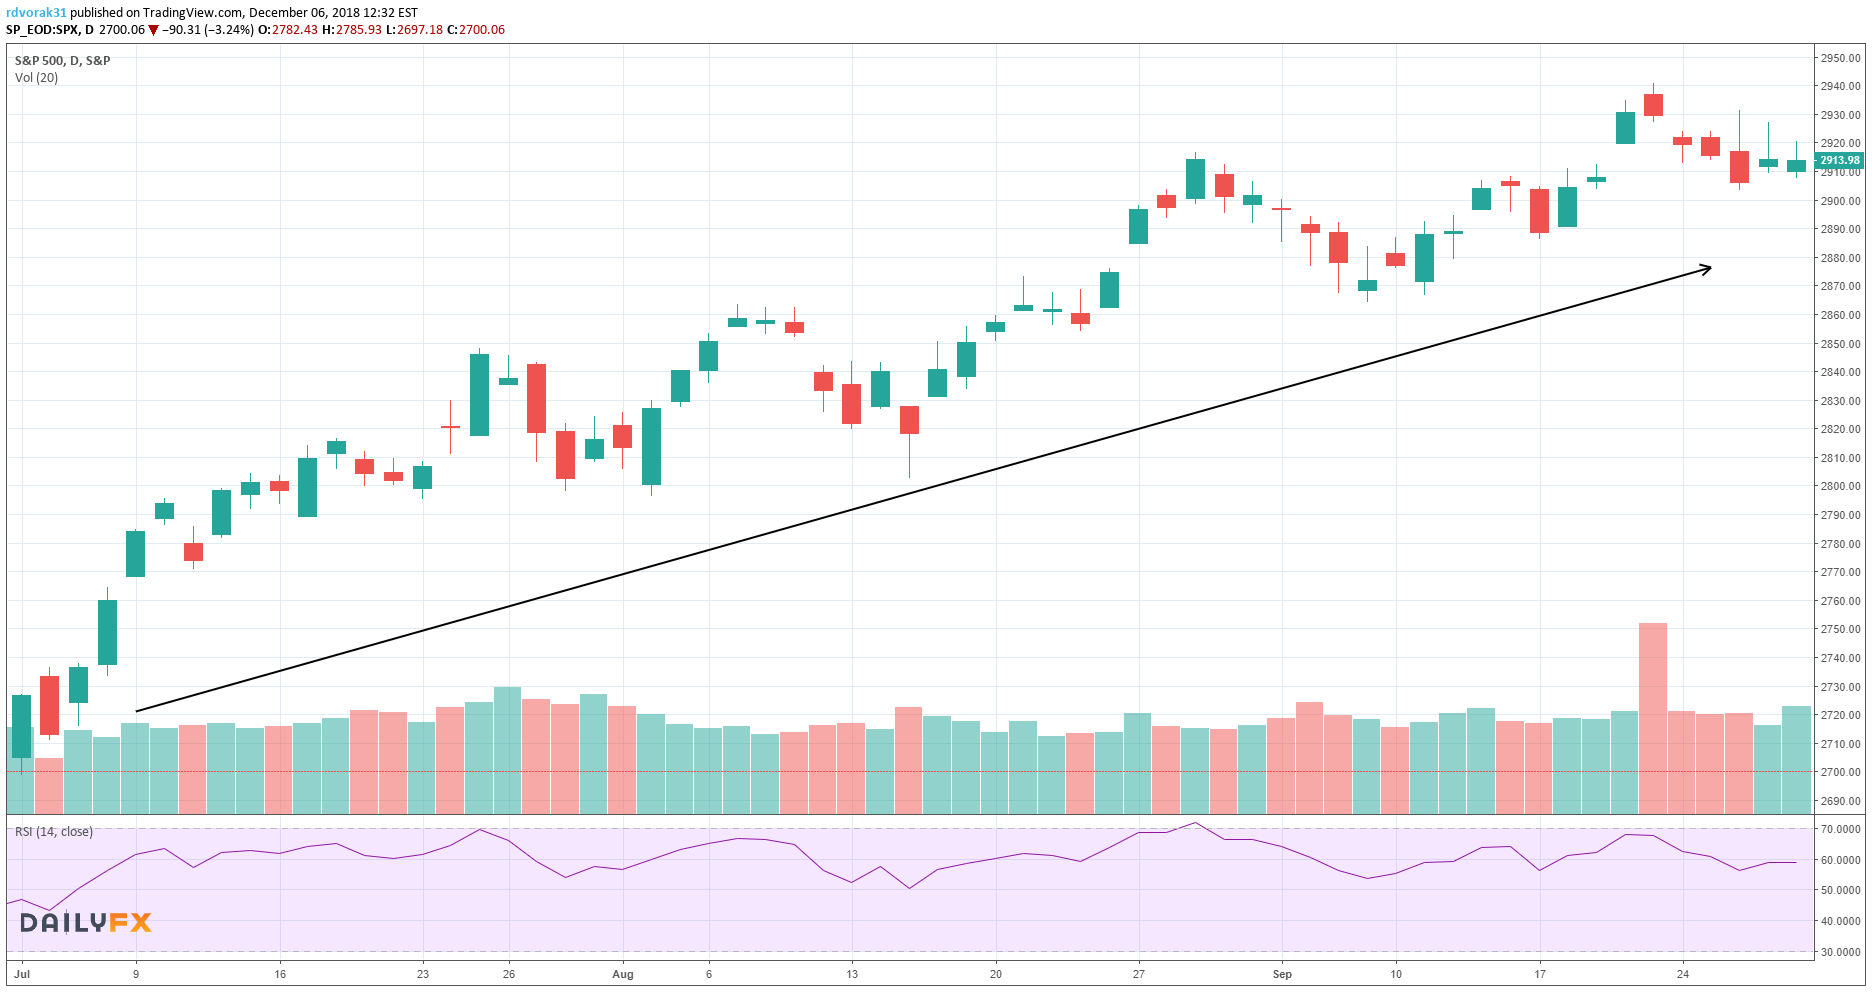
With the S&P500 notching its all-time high of 2,940.91 the US stock market enjoyed gains exceeding 7 percent. The rise in equities was attributable record corporate profits, consistently strong data coming out of the US economy and strong demand from foreign investors.
Wage growth also had a major impact on the rise in net worth for US households as average hourly earnings rose most recently at a 3.1 percent year-over-year. Tax cuts have likely continued to make a positive impact on household worth as savings trickle down to American pocketbooks. Notable was the annualized rate of change in value of owner’s real estate equity which slowed to 5.6 percent compared to 8.2 percent, 11.4 percent and 10.4 percent over the preceding quarters. This adds to the mounting evidence of concerns over a deteriorating housing market.
The healthy increase in household net worth should support consumer spending headed into the holiday shopping season. However, the backdrop of a robust US economy is beginning to fade. Business owner sentiment is plateauing as forecasts for future economic growth are lowered due to concerns over global trade conflict and international risks such as Brexit. As of December 6, the S&P500 has slid over 8 percent since the beginning of October which will certainly impede additional gains in household net worth if the US stock market cannot recover. Further increases in household leverage and inflationary pressures if materialized could act as a headwind to net worth in the final quarter of 2018.
After the report was released, the S&P500 saw some relief from the big selloff in early trading.

To see future data releases on key variables driving markets, check out the DailyFX economic calendar.
--Written by Rich Dvorak, Junior Analyst for DailyFX.com
--Follow on Twitter @RichDvorakFX


