


USDJPY Price, Chart and Analysis:
- USDJPY touches a fresh 10-week high just under 112.00.
- Chinese manufacturing data beats expectations and reinforces the risk-on move.
Q1 2019 USDand JPY Forecast and Top Trading Opportunities
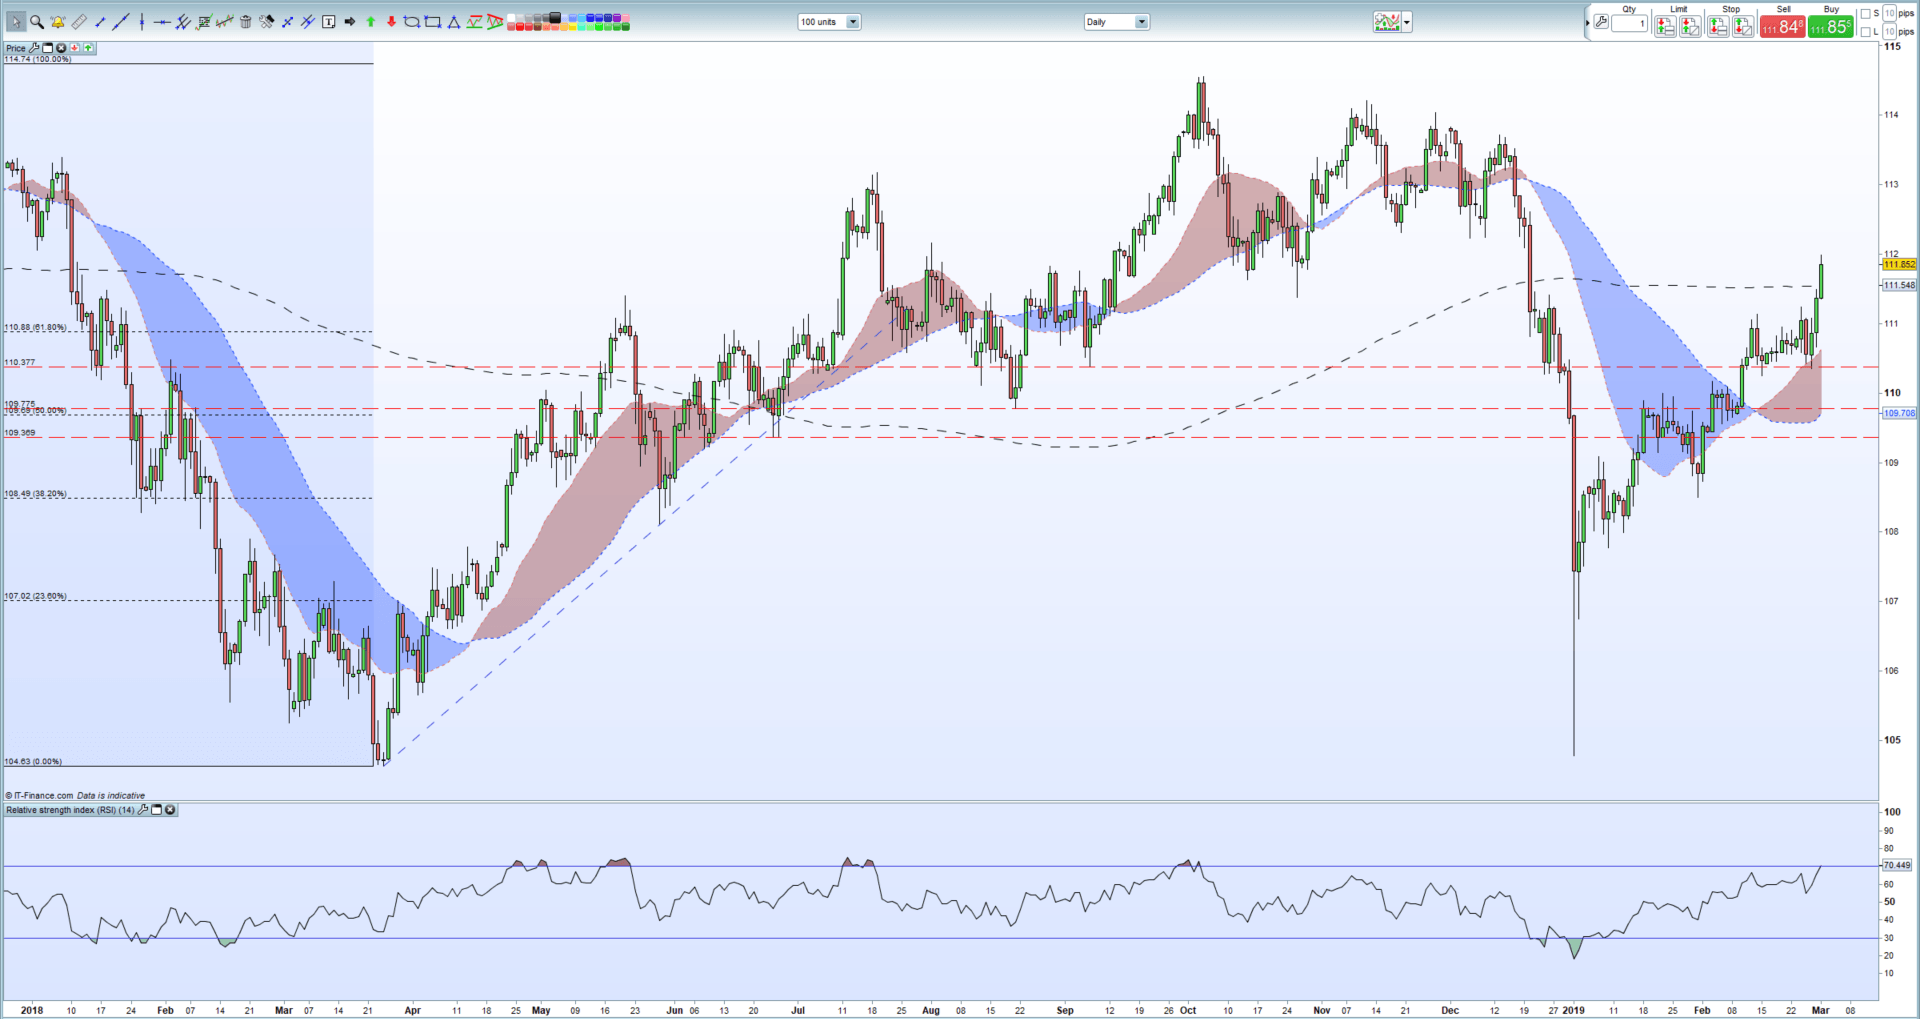
USDJPY has just made a first attempt at 112.00, a level last seen on December 20, 2018, and has broken above the 200-day moving average as financial markets turn risk-on going into the weekend. Thursday’s better-than-expected US Q4 GDP figures – 2.6% vs 2.2% expectations – gave the US dollar an uplift while the Caixin China Manufacturing PMI (February) released earlier today added to the move. The Chinese PMI came in at 49.9 against expectations of 48.7 and a prior reading of 48.3.
How Market Sentiment & Confidence Releases Can Improve Your Trading.
The risk-on move was noticeable across the board with broad-based gains in global equity markets, while gold and the Swiss Franc – both risk-off asset plays – both slipped lower. Equity markets have also taken heart from news that global index provider MSCI will hike its weighting of Chinese A shares in its indices from 5% to 20%. The latest move in USDJPY has seen it take out the long-term moving average which should open the way for further gains. Thursday’s move higher also pushed the pair through the 61.8% Fibonacci retracement level at 110.88, again adding to the current bout of positive sentiment. The pair are now touching overbought territory and may see a brief period of consolidation ahead of a series of recent lower highs between 113.75 and 114.55
USDJPY Daily Price Chart (January 2018 – March 1, 2019)
Retail traders can access the latest IG Client Sentiment Data for a range of currencies and commodities. The data shows how retail positioning, and daily and weekly changes, can help when looking for a trade set-up. Retail are 42.9% net-long USDJPY, a bullish contrarian set-up.
Traders may be interested in two of our trading guides – Traits of Successful Traders and Top Trading Lessons – while technical analysts are likely to be interested in our latest Elliott Wave Guide.
What is your view on the USDJPY – bullish or bearish?? You can let us know via the form at the end of this piece or you can contact the author at nicholas.cawley@ig.com or via Twitter @nickcawley1.


