


USDCAD Implied Volatility - Talking Points:
- USDCAD 1-week implied volatility seems subdued as currency option traders expect muted price action
- Several key economic indicators scheduled for release out of the United States and Canada could push the forex pair outside its statistical trading range
- Technical indicators are portraying a mixed message, with prices trading comfortably between near-term support and resistance
Canadian Dollar implied volatility looks depressed compared to its historical average. This is particularly interesting seeing that significant event risk lies ahead for the currency. One-week (1W) implied volatility currently rests at 5.87 percent, which is below last year’s average of 7.20 percent.
USDCAD IMPLIED VOLATILITY PRICE CHART: DAILY TIME FRAME (JANUARY 01, 2018 TO FEBRUARY 25, 2019)
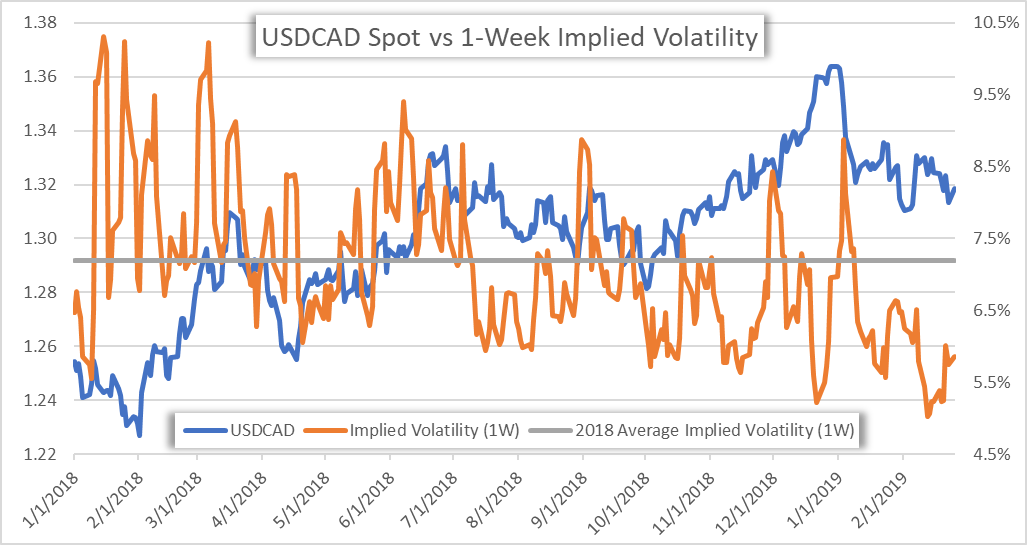
With USDCAD spot prices currently resting at the 1.319 level, the implied volatility priced by the forex option market suggests that the currency pair will trade between 1.315 and 1.323. That’s a narrow band considering the plethora of economic data slated for release over the next few days.
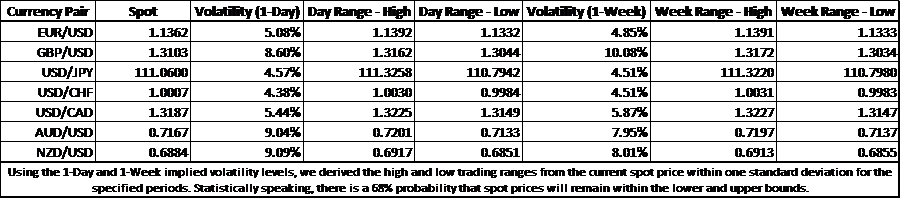
FOREX MARKET IMPLIED VOLATILITY AND TRADING RANGES
Notably, the Canadian Consumer Price Index for January is scheduled to cross the wires at 13:30 GMT tomorrow along with the US Advance Goods Trade Balance for December – both of which have market-moving potential if actual data comes in materially above or below consensus.
Check out the free comprehensive Economic Calendar by DailyFX here for a full list of upcoming data releases affecting major currency pairs.
Also, 4Q 2018 GDP numbers out of the US and Canada will be released Thursday and Friday respectively, while manufacturing PMIs for the two countries will come out at the end of the week.
USDCAD CURRENCY PRICE CHART: 4-HOUR TIME FRAME (JANUARY 14, 2019 TO FEBRUARY 26, 2019)
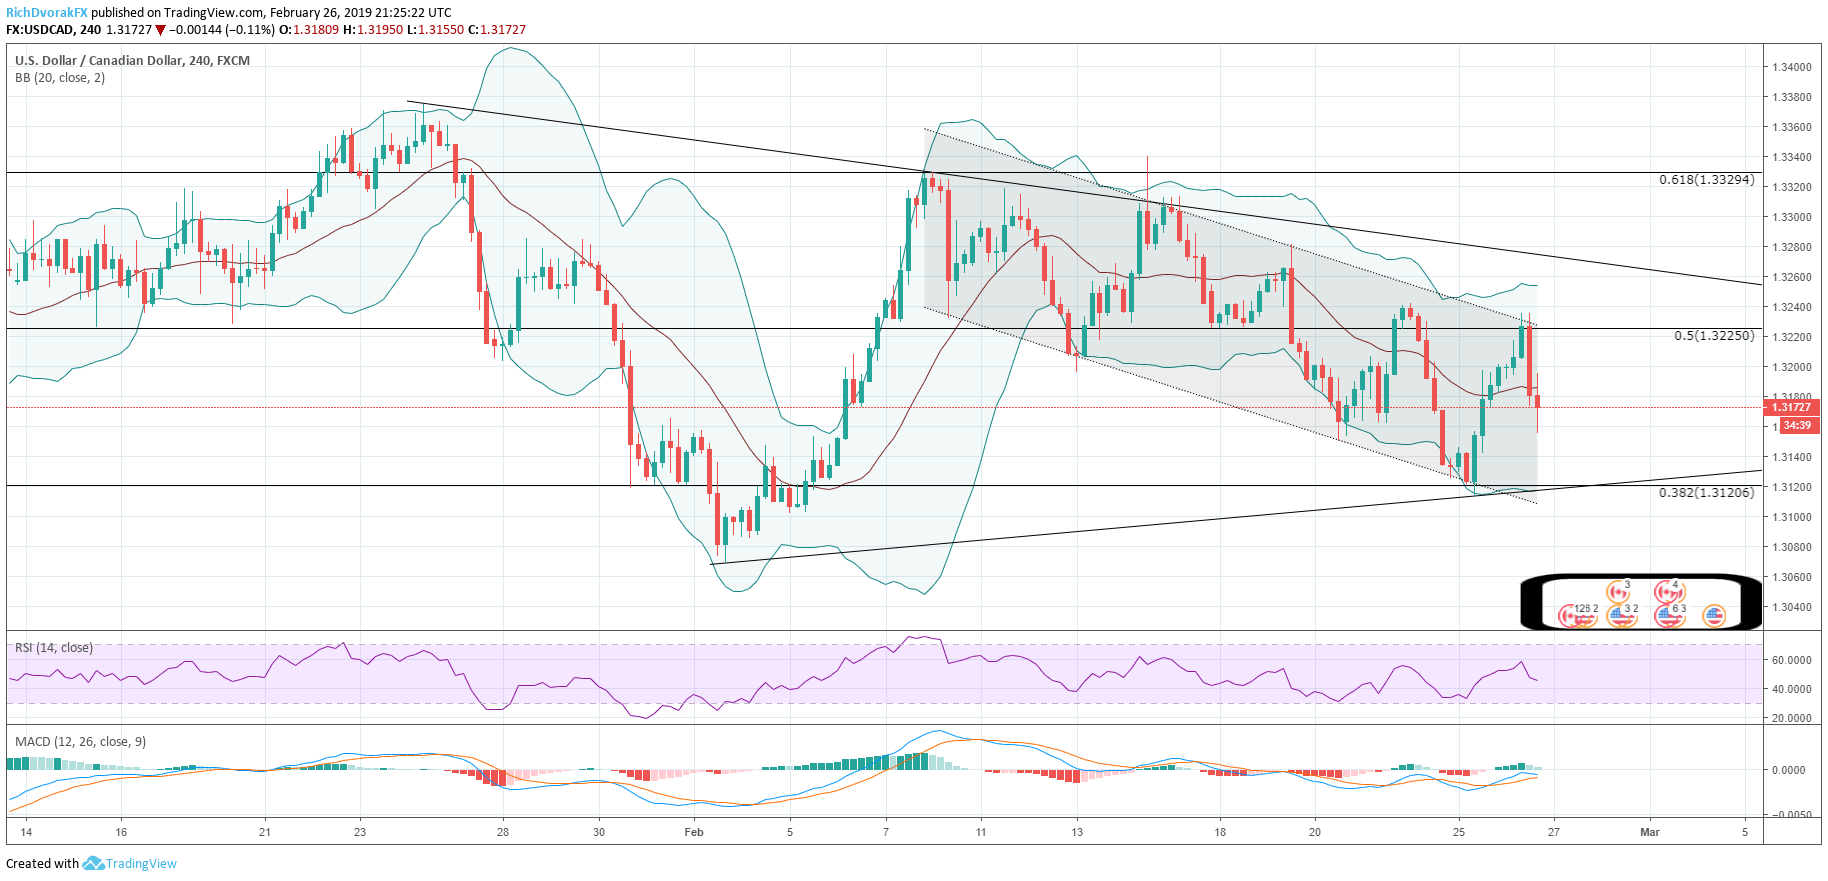
USDCAD technical indicators now portray a mixed message with prices trading comfortably between near-term support and resistance at the 0.382 and 0.500 Fibonacci retracement levels.
The bearish downtrend witnessed over the last two weeks could represent a bullish flag, however, which suggests prices could pivot higher. As the setup continues to evolve, oil prices could serve as a bellwether to the CAD’s next direction if economic data is reported in line with market expectations.
---
Written by Rich Dvorak, Junior Analyst for DailyFX
Follow on Twitter @RichDvorakFX
Check out our Education Center for more information on Currency Forecasts and Trading Guides.


