Gold (XAU) Price, News and Chart:
- Gold continues to find support around $1,300/oz.
- If US-China trade tensions ease, then support may be re-tested.
Q1 2019 Gold Forecast and Top Trading Opportunities
Gold’s (XAU) recent nine-month high around $1,326/oz. may remain in place over the next few weeks with the precious metal finding it difficult to push appreciably higher. The recent strength of the US dollar has weighed on XAU and any easing of trade tensions between China and the US may add downside pressure on the precious metal. Although still over two weeks away, March 1 remains an important date for traders with the US promising to ramp up tariffs on Chinese goods at the start of March if no progress has been made during the ongoing trade talks. China has already said that it would impose its own set of tariffs on US imports if this happens, escalating the situation further.
The US dollar has also found support from investors of late with other major currencies weakening on fears of slowing domestic and global growth and the growing realization that tighter monetary policy in 2019 is no longer the given many thought it would be in mid-late 2018. While US Treasury yields have eased lower recently, they still offer a considerable premium to other major currencies, supporting the greenback.
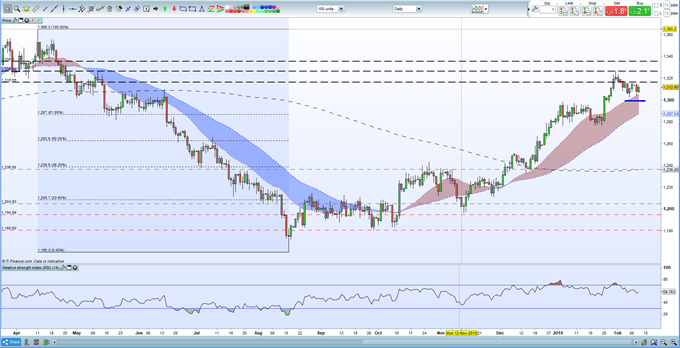
The daily gold chart shows the $1,300/oz. area as a relatively strong support zone with the 20-day moving average at $1,305/oz. offering some first-line support. Gold trades above all three daily moving averages and has moved out of overbought territory and if the above levels do break down, $1,287/oz. a meeting of the 61.8% Fibonacci retracement level and the 50-day moving average should offer strong support.A trading range between $1,300/oz. and $1,326/oz. is looking increasingly likely in the near-term, all things being equal.
Gold Price May Fall if US Government Avoids Another Shutdown
How to Trade Gold – Top Strategies and Tips
Gold Daily Price Chart (March 2018 – February 12, 2019)

Retail traders are 70.9% net-long Gold according to the latest IC Client Sentiment Data, a bearish contrarian indicator. Recent changes in daily and weekly sentiment however suggest a stronger bearish bias for gold.
Traders may be interested in two of our trading guides – Traits of Successful Traders and Top Trading Lessons – while technical analysts are likely to be interested in our latest Elliott Wave Guide.
What is your view on Gold – bullish or bearish?? You can let us know via the form at the end of this piece or you can contact the author at nicholas.cawley@ig.com or via Twitter @nickcawley1.


