


Talking Points:
- United States Existing Home Sales for December drops the most since November 2015
- The reading echoes investor fears of a late economic cycle slowdown
- The trend of worsening economic data and fading market optimism continues
Appetite for risk is quickly souring again on the back of reignited concerns over global growth and the economic cycle. The United States just released its Existing Home Sales data for December which showed a whopping 6.4 percent decline from the prior period. The reading compares to an expected decline of only 1.5 percent.
US EXISTING HOME SALES PRICE CHART: MONTHLY TIMEFRAME (JANUARY 2007 TO DECEMBER 2018) (CHART 1)

The drop highlights a persistent weak spot in the US economy which has been under pressure for the last several months. Although existing home sales are not included in GDP calculations, the slowdown in the indicator can provide insight on the severity of the weakening real estate market in the United States which indirectly impacts American sentiment and consumption. Also, the decline begins to scratch the surface of the impact from a US Government Shutdown as the review and approval of certain mortgage loan applications are delayed.
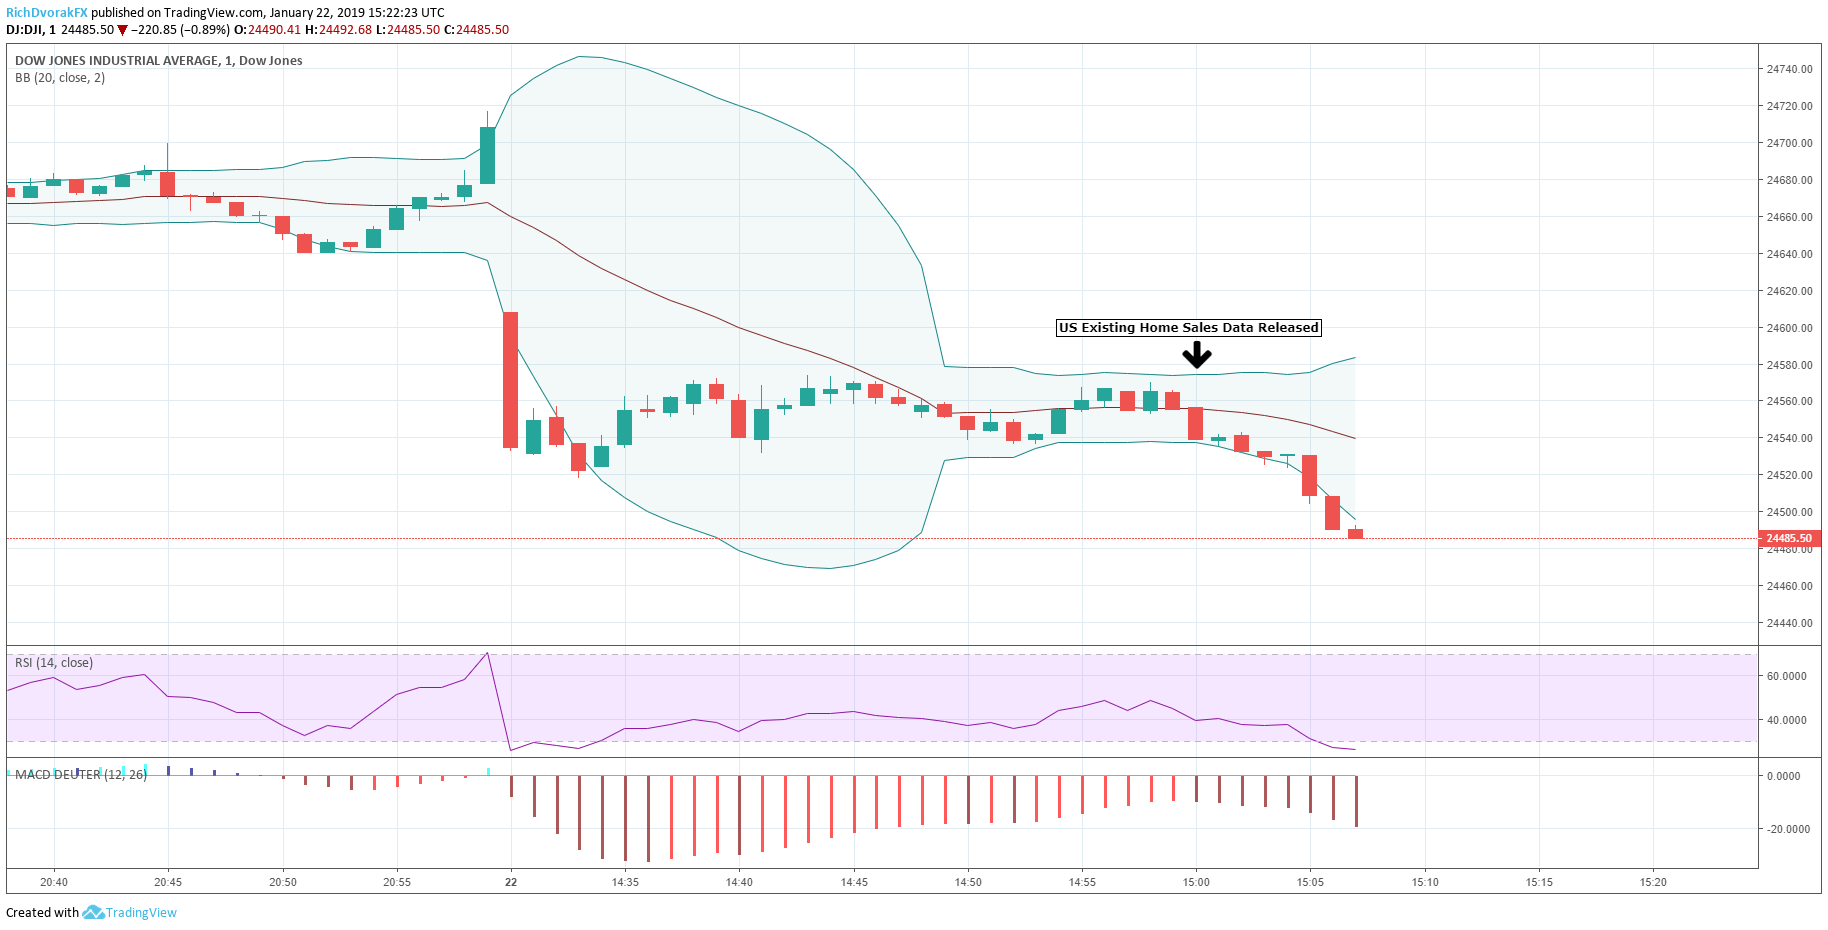
The Dow Jones and US Dollar Index both took poorly to the news and extended their declines immediately following the report. This looks to exacerbate the shifting sentiment to a more pessimistic tone seen so far this week as risks surrounding slowing growth, tightening financial conditions and political instability resurface.
US DOW JONES INDEX PRICE CHART: 1-MINUTE TIMEFRAME (JANUARY 22, 2019 INTRADAY) (CHART 2)
US DOLLAR INDEX DXY PRICE CHART: 1-MINUTE TIMEFRAME (JANUARY 22, 2019 INTRADAY) (CHART 3)

---
Written by Rich Dvorak, Junior Analyst for DailyFX
Follow on Twitter @RichDvorakFX
Check out our Education Center for more information on Currency Forecasts and Trading Guides.


