


Talking Points:
- Current bull market began on March 9th, 2009 (3,453 days long) and quadrupled the price of the S&P 500
- The ‘hottest’ run was the previous record between 1990-2000, posting a 417% gain in 3,452 days
- Opportunities to sustain the bull market seem to be waning as risks rise and once-attractive investments are drained of their value
A Record-Setting August
August has been a month of milestones for US markets with Apple reaching $1 trillion on August 2nd, the S&P 500 returning to form with a fresh intraday all-time high tagged on August 21st, and US equities entering their longest ever bull run with August 22nd’s close. The milestones have been reached despite a tumultuous market landscape with emerging market turmoil, trade wars, and gradually rising interest rates in many major economies. Still, the headwinds have not been enough to hold off a decade-long bull run.
Click here to read a brief history of Trade Wars.
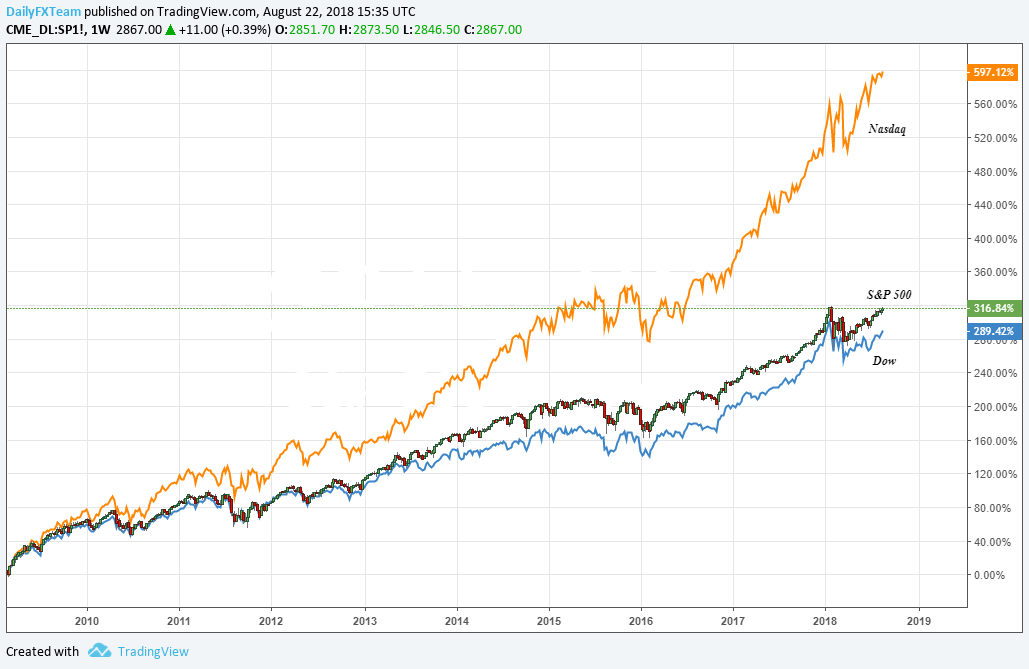
The record-long run began March 9th, 2009 after the S&P 500 reached a low of 666. Since then, the index price has quadrupled, closing Wednesday at 2,863. The percentage increase over the duration, 315%, is a staggering return. Despite such a large advance, the current bull run is not the ‘hottest’ ever. The climb from 1990-2000, which ended with the Dot-com bubble burst, returned 417% in 3,452 days. Still, the current run is quite extraordinary. During this time, the NASDAQ has climbed nearly 600%, led by FANG members which have struggled in recent weeks. The Dow grew roughly 290% despite being only the third longest run for the long-standing industrial average. The bull markets ending in 1961 and 1929 both surpass the Dow’s current streak.
As US equities post record highs and the markets enter the longest bull-run ever, check out our sentiment indicator to see if clients expect it to continue.
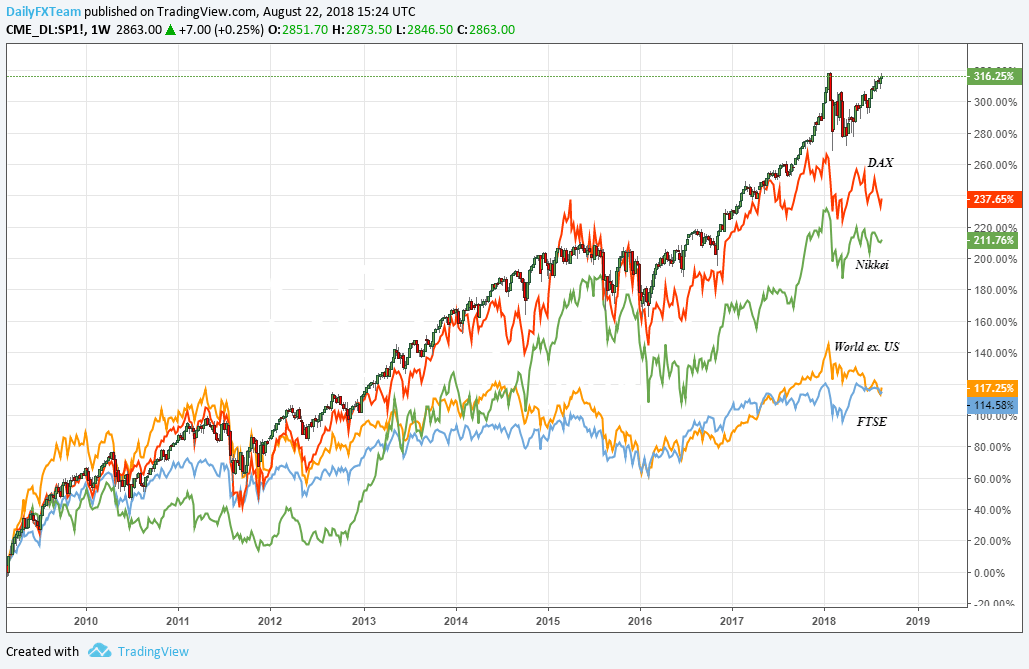
US Equity Growth Outpaces Peers
During this bull trend phase, the S&P 500 has handily outpaced other major equity indices from Japan, Germany, and the United Kingdom. While markets are not the most accurate measure of economic health, they are certainly linked. So, while the world has enjoyed an economic recovery over the past 10 years, its largest member seems to have set the pace for the climb beyond mere recovery.
Although investors may have deemed US equities as an attractive opportunity, the latter stages of this ongoing run have not materialized from sentiment alone. Corporate tax cuts and strong corporate earnings buoyed the world’s largest economy even as the government has waged trade wars against its largest trader partners and pursued sanctions against some of the largest emerging markets participants.
Sustenance for Bulls May be Hard to Find
While the bull run presses on, the questions of what sustains it moving forward and for how long are regularly posed by skepticism and optimists alike. With trade wars, rising interest rates, record low unemployment, and record levels of corporate buybacks; the new opportunities for expanding growth seem fewer and further between. Possible further tax cuts have been floated by the Trump administration, but would likely take significant time and negotiation as mid-term elections threaten to shake up the House and Senate compositions. While investors continue to look for the stimulus that will keep driving markets upward, it may be time to re-assess risk profiles and capital allocation until an opportunity presents itself.
DailyFX forecasts on a variety of currencies such as the US Dollar or the Euro are available from the DailyFX Trading Guides page. If you’re looking to improve your trading approach, check out Traits of Successful Traders. And if you’re looking for an introductory primer to the Forex market, check out our New to FX Guide.
--Written by Peter Hanks, Junior Analyst for DailyFX.com


