GBPUSD Prices, News and Analysis
- Sterling hits a multi-month low against a resurgent US dollar.
- Technical analysis sees 1.27780 hove into view.
IG Client Sentiment shows 73.8% of traders are net-long with the ratio of traders long to short at 2.82 to 1 – giving us a strong bearish contrarian trading bias.
GBPUSD Price Action Driven by the US Dollar.
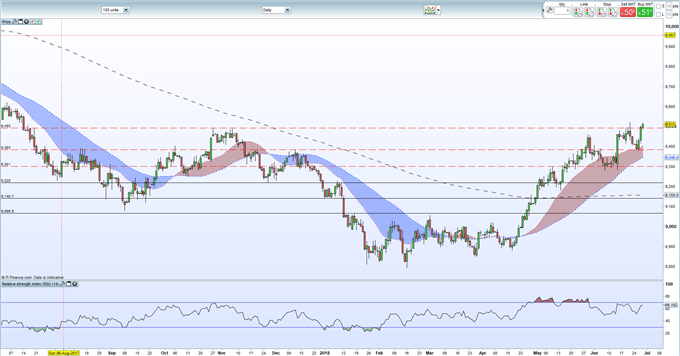
Sterling continues to struggle against a resurgent US dollar with GBPUSD heading towards a fresh multi-month low and a potential break below 1.3000. The greenback got a boost Wednesday after US President Trump appeared to ease back on some of his harsher trade restrictions with China. The US dollar immediately broke to the topside and is now making a new multi-month high with further gains likely as the US continues to hike rates in the months ahead. Sterling also faces a couple of potentially tricky days ahead with Brexit on the menu at the EU Summit which starts today. No resolution is expected but a further round of negative talk from the EU will increase fears of a no-deal Brexit which neither side really wants.
US Dollar Basket Daily Price Chart (July 2017 – June 28, 2018)

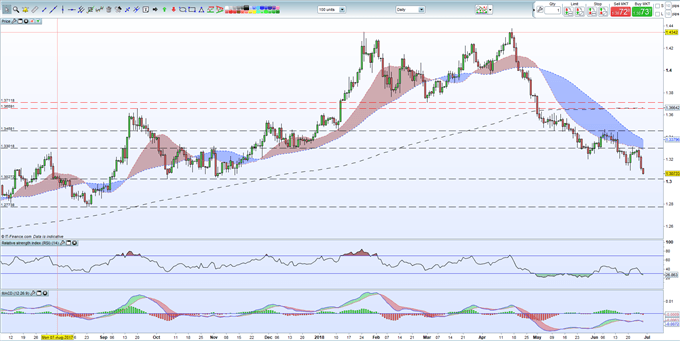
GBPUSD now looks set to break below 1.3000 unless Sterling can garner some strength from some quarter. While the British Pound continues to perform well against the NZD and CAD, and only marginally underperform against the EUR, GBPUSD is a victim of a strong USD complex. Client sentiment also shows that retail remain heavily long of the pair.
The chart below shows the 1.3040 November low is now the final level of support before the August low at 1.2774 comes into play. The RSI indicator is now in oversold territory, but pointing lower, while the MACD ribbon remains negative.
GBPUSD Daily Price Chart (July 2017 - June 28, 2018)

DailyFX has a vast amount of updated resources to help traders make more informed decisions. These include a fully updated Economic Calendar, and a raft of Educational and Trading Guides
--- Written by Nick Cawley, Analyst
To contact Nick, email him at nicholas.cawley@ig.com
Follow Nick on Twitter @nickcawley1


