EURUSD News and Talking Points
- Euro-Zone inflation is likely to beat expectations due to higher oil prices.
- EURUSD mini-rally may be impeded by chart resistance.
The DailyFX Q2 Trading Forecasts for all major currencies, commodities and indices, are now availableto download to help you make more informed trading decisions.
EURUSD Nears Resistance, Heavyweight US Data
EURUSD has rallied back in the last 48-hours as political tensions, and bond yields, ease. While the pair may still be in a downward trend, the recent snap-back looks likely to continue although upcoming heavyweight US data may stall the move. Later today, the Fed preferred measure of inflation, core PCE will be released along with initial jobless claims and pending home sales. And to round the week off on Friday, the monthly non-farm payrolls and ISM manufacturing data.
In Europe, May inflation data is expected to show a pick-up in price pressures due to higher oil prices, with the headline figure rising from 1.2% to 1.8% or higher, while core inflation is expected to nudge up to 1.0% from 0.7%, still a long way from the ECB’s mandate.
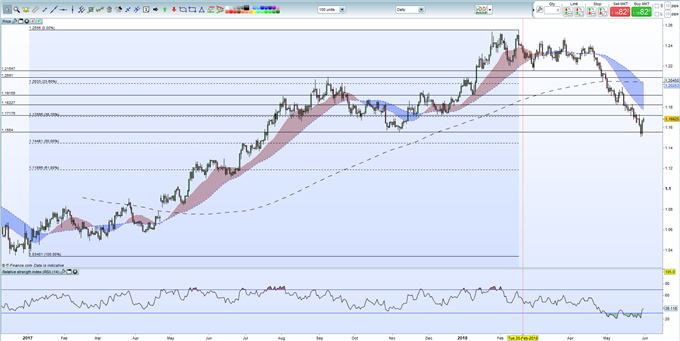
The recent EURUSD rally from a 10-month low of 1.15099 is now facing a cluster of resistance levels that need to broken – and closed above – if the pair are going to push further ahead. First up the 38.2% Fibonacci retracement of the January 2017 – February 2018 move at 1.17095 which lies just below the 1.17175 December swing low. Just above this, the 20-day moving average at 1.17710 will provide further resistance.
The latest IG Client Sentiment Indicator shows retail however are 52.5% net-long EURUSD but recent positional changes suggest that the pair may move higher.
EURUSD Price Chart Daily Timeframe (December 2016 – May 31, 2018)

If you are new to foreign exchange, or if you would like to update your knowledge base, download our New to FX Guide and our Traits of Successful Traders to help you on your journey.
What’s your opinion on the EURUSD? Share your thoughts with us using the comments section at the end of the article or you can contact the author via email at Nicholas.cawley@ig.com or via Twitter @nickcawley1
--- Written by Nick Cawley, Analyst


