


Bitcoin (BTC), Ripple (XRP), Litecoin (LTC) News and Analysis
- Bitcoin is back above $9,000 but a bearish ‘death cross’ may be forming.
- Ripple is trading sideways and is likely to stay that way in the short-term.
- Litecoin and Ethereum are both respecting down trends for now.
We have recently released A Guide to Day Trading Bitcoin & Other Cryptocurrencies to help traders navigate this volatile marketplace.
Cryptocurrency Market Recovers the Weekend’s Losses
After losing between 10% and 15% over the weekend, the cryptocurrency took solace from a benign statement from the G20 regarding the digital space and pushed back, reclaiming all of the week’s/weekend’s losses. Trade still remains quiet, with volatility low, as traders try and work out if the market is oversold in the short-term or if the bearish trend from the beginning of the year is still intact. We warned last Friday that weekend trade may become volatile as sideways trends can often bring sharp breakouts, especially in a 24/7 marketplace.
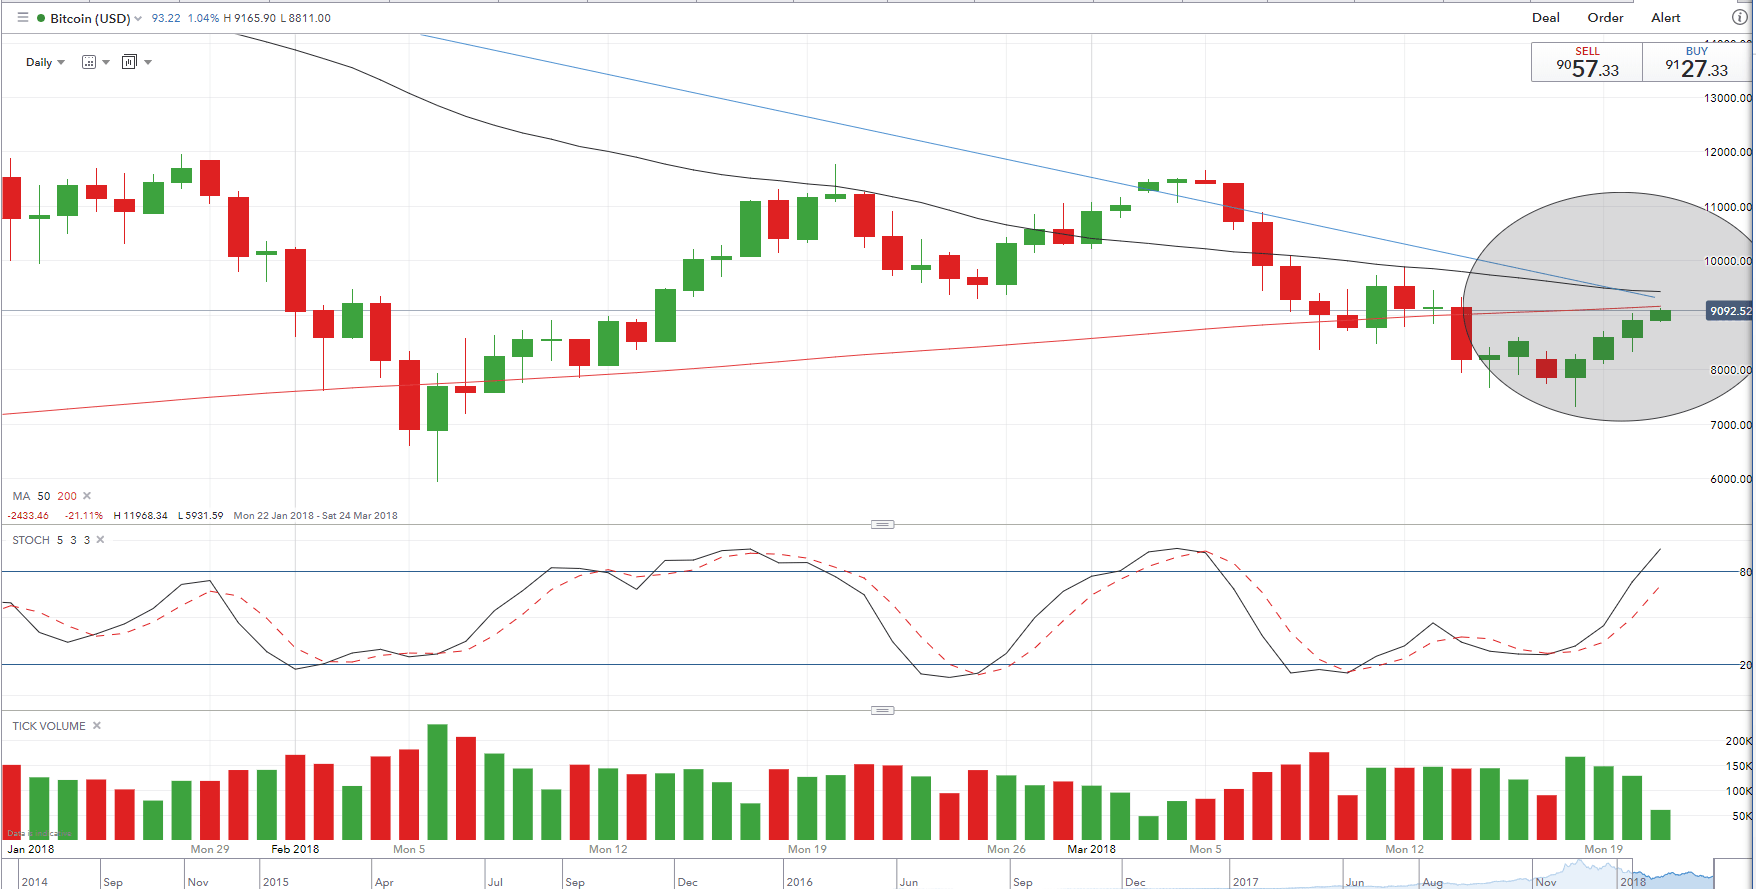
Last week we came away from the webinar with a negative outlook across the board with most chart set-ups suggesting lower prices. This week the takeaway is neutral as the latest charts are giving nothing away and we don’t want to chase trades unnecessarily. One chart that may be forming an ominous sign is Bitcoin (BTC) with the 50-day ma (black line) looking likely to break below the 200-day ma (red line), making a bearish ‘death cross’.
Bitcoin Price Chart with Potential Death Cross (January 22 – March 21, 2018)
Cryptocurrency Trader Resources
If you are interested in trading Bitcoin, Bitcoin Cash or Ethereum check out our Introduction to Bitcoin Trading Guide.
What’s your opinion on the cryptocurrency market at the moment? Share your thoughts with us using the comments section at the end of the article or you can contact the author via email at Nicholas.cawley@ig.com or via Twitter @nickcawley1.
--- Written by Nick Cawley, Analyst.


