


USD Price and Talking Points
- The US Dollar Index is looking at a period of consolidation ahead of the next move higher.
- EURUSD weakness likely to remain.
The Traits of Successful Traders and how to find the Number One Mistake Traders Make are just two of the important topics covered in our Free Trading Guides.
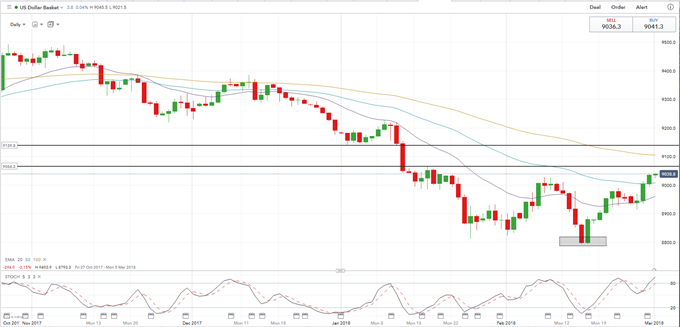
US Dollar Index (DXY) Chart Throws up Differing Technical Signals
The recent bout of US Dollar Index (DXY) strength, driven largely by a recently hawkish testimony from new Fed chair Jerome Powell, has covered the chart with a variety of bullish signals, although momentum seems overstretched at the moment. A period of consolidation is likely before the next push higher.
Bullish technical DXY indicators include a strong ‘double-bottom’ made on February 15 – 15 around the 87.90-87.95 which coincided with extreme ‘oversold’ market conditions. The subsequent rally has seen DXY break back above the 20- and 50-day EMA and trade at levels last seen five weeks ago. Ahead a gap on the January 12 bear candle between 90.66 and 91.37 is likely to be filled which would also take DXY above its 100-day EMA, another bullish indicator. And if dollar bulls need another sign, DXY has just made four higher lows and higher highs in a row, although current price action may change the latter.
The stochastic indicator on the bottom of the chart however shows the dollar in extreme ‘overbought’ territory and may keep DXY back in the short-term before the next push higher.
US Dollar Bottoming Effort Takes a Step Forward
US Dollar Index (DXY) Daily Price Chart (October 29, 2017 - March 1, 2018)
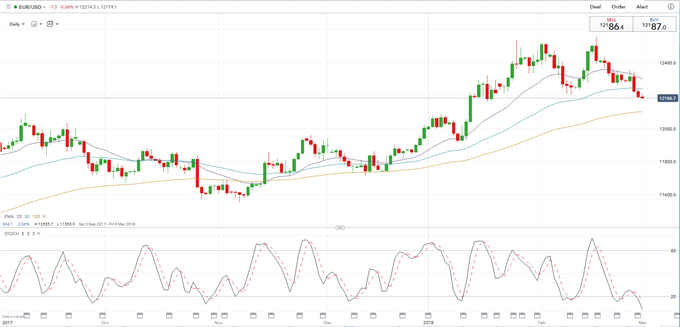
EURUSD Weakens and Targets 1.2100 or Lower
With the USD currently on a roll, EURUSD has weakened in lock-step with the chart highlighting further downside targets. A gap on the January 12 bull candle down to just below 1.2100 is protected by the 100-day EMA at 1.2105 with both looking likely to fall. In the polar opposite to the DXY, the stochastic indicator highlights extreme ‘oversold’ conditions which may delay the next leg lower.
EURUSD Daily Price Chart Daily (September 1, 2017 – March 1, 2018)
Retail Traders Remain Short of EURUSD but Outlook Mixed
IG Client Sentiment data show 42.1% of traders are net-long with the ratio of traders short to long at 1.38 to 1. In fact, traders have remained net-short since Apr 18 when EURUSD traded near 1.056; price has moved 15.4% higher since then. The number of traders net-long is 3.8% lower than yesterday and 24.7% higher from last week, while the number of traders net-short is 19.4% higher than yesterday and 17.5% higher from last week.
We typically take a contrarian view to crowd sentiment, and the fact traders are net-short suggests EURUSD prices may continue to rise. Positioning is more net-short than yesterday but less net-short from last week. The combination of current sentiment and recent changes gives us a further mixed EURUSD trading bias.
What’s your opinion on EURUSD?Share your thoughts with us using the comments section at the end of the article or you can contact the author via email at nicholas.cawley@ig.com or via Twitter @nickcawley1.
--- Written by Nick Cawley, Analyst


