Talking Points
- The price of Brent crude oil has topped $60 per barrel for the first time since July 2015 and could yet climb further.
- However, its advance is likely to pause soon and it could well give up some of its gains.
What Does the Fourth Quarter Hold for Oil, the Dollar, Equities and Other Key Markets? Find out here
The price of Brent crude oil, the global benchmark, has jumped above $60 per barrel as the advance that began in June continues. However, the climb that has taken it to its highest level for more than two years in likely to run out of steam before too long.
From a fundamental perspective, the price has benefited in recent days from expectations that OPEC-led production cuts will be extended beyond March, possibly until the end of next year, although such a move is likely to spur more US production.The Organization of the Petroleum Exporting Countries plus Russia and nine other producers agreed to cut 1.8 million barrels per day from January 2016 to clear a supply glut, and both Saudi Arabia and Russia have pressed for the further extension as an OPEC meeting on November 30 approaches.
In addition to signs that producers have improved their compliance with current quotas, data from the American Petroleum Institute have shown a bigger-than-expected decline in US crude and gasoline inventories last week. More weekly data due this session from the US Energy Information Administration are expected to show a drop of 1.756 million barrels in crude stocks, compared with the previous rise of 0.856 million.
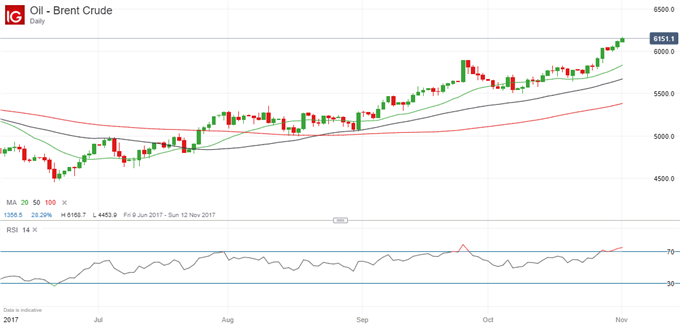
That has lifted the price of Brent crude but a retracement seems likely now both the September high at $58.92 and the “round-number” resistance at $60 have been taken out. One possible stumbling block could be the highs close to $63 reached in February 2015, especially as the 200-week moving average comes in around the same level.
Additionally, as the 14-day relative strength indicator at the bottom of the chart below shows, the RSI is now above 70 so in overbought territory.
Chart: Brent Crude Oil Daily Timeframe (June 10 – November 1, 2017)

Note too that the Brent/WTI spread – the difference in price between the global benchmark and the US benchmark – is currently at $6.37 after reaching around $7, its highest for more than two years.
--- Written by Martin Essex, Analyst and Editor
To contact Martin, email him at martin.essex@ig.com
Follow Martin on Twitter @MartinSEssex
For help to trade profitably, check out the IG Client Sentiment data
And you can learn more by listening to our regular trading webinars; here’s a list of what’s coming up
Check out our Trading Guides: Several new ones are now available including Forex for Beginners, Building Confidence and Traits of Successful Traders
Like to know about the Traits of Successful Traders? Just click here
Or New to Forex? That guide is here


