


Talking Points:
- Parallels can be drawn between EURNOK and USoil price action in 2008 and 2014
- December 2014 candle prints largest range in six years
- EURNOK and Oil continue moving in opposite directions into January 2015
The value of the Norwegian Krone is heavily influenced by the price of oil, as it accounts for 25% of the nation’s GDP, 30% of the government’s revenues, and 50% of the nation’s exports. Thus, when paired with the Euro, a strong negative correlation developed between the EURNOK and USoil in both 2008 (-0.802) and 2014 (-0.827) when substantial market movements occurred. From this strong relationship, parallels can then be drawn between the currency pair and the commodity’s price action in the preceding years.
In December of 2008, Oil closed out a six month decline, dropping from 147.27 to 36.18. In the subsequent months, after retesting its previous low, oil prices found support and began printing higher highs and higher lows. Simultaneously, liquidity concerns heightened and the EURNOK subsequently rose from a low of 7.898 to a high of 10.117, before a reversal in trend. Market participant’s new willingness to purchase NOK in January coincided with the aforementioned easing of pressure on the price of oil.
In similar fashion, USoil closed December 2014 with a 49% decline in price, dropping from 106.50 to 53.59. Concurrently, the EURNOK rose from a low of 8.096 to a high of 9.881 at which point price action indicated the potential for a reversal. The long wick extending above the body of December’s candlestick indicated that buyers were able to push price up significantly before sellers overcame them and brought the price back down. However, despite the tendency for the seller’s strength to carry forward, it was the buyers who persisted and prices have instead continued to rise. The irregularity likely the result of oils continued descent. Thus, as oil continues to fall the NOK will likely remain weak. However, if oil turns than the NOK may appreciate as it did in January 2009.
EUR/NOK Monthly Chart
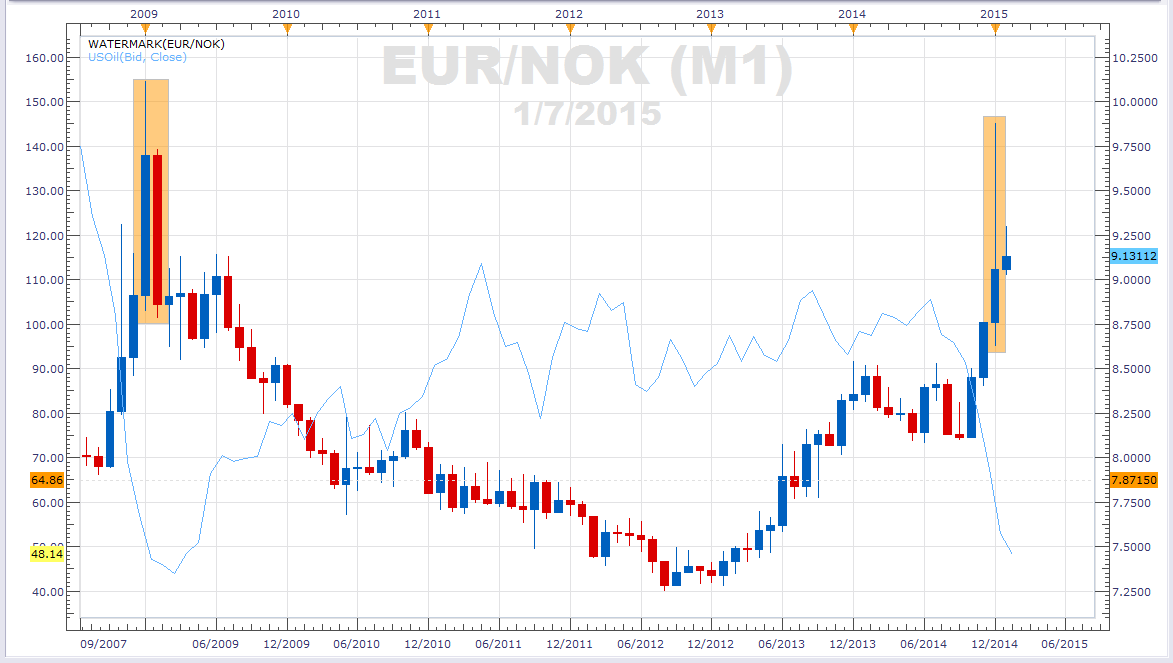
Chart Created Using MarketScope2.0


