


US Dollar Outlook: Fed Meeting Minutes Steer USD & Treasury Yields Higher
- July 2020 Fed meeting minutes sparked volatility in the US Dollar and gold prices
- Treasury yields snapped higher with the FOMC showing little appetite for capped rates
- The USD likely catching bid also as the Fed strikes a cautious tone on economic outlook
USD price action is ripping higher and on pace to gain nearly 0.75% today measured by the US Dollar Index. A sharp rally staged by the US Dollar seems to largely coincide with the release of July 2020 FOMC minutes, which detailed less optimistic economic outlook than previously forecasted. The latest Fed meeting minutes also stated how “a more pessimistic projection was no less plausible than the baseline forecast.”

US Dollar Index Price Chart & Ten-Year Treasury Yield Overlaid: 1-Hour Time Frame (17 AUG TO 19 AUG 2020)
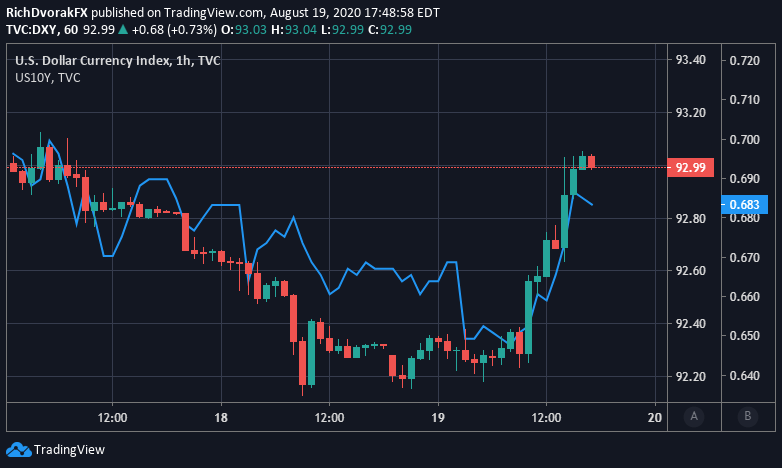
Chart created by @RichDvorakFX with TradingView
This might have fueled an influx of investor risk aversion and possibly corresponded with a rise in US Dollar demand. The USD also seemed to advance alongside a sharp rally in Treasury yields. The ten-year Treasury yield jumped about 3-basis points to 0.683% and the DXY Index rebounded toward the 93.00-handle.

Slowing Fed asset purchases stands out as another potential explanation for the move. According to the FOMC minutes, there has been a welcomed improvement in financial conditions with many market functioning indicators returning to pre-pandemic levels and “purchases were conducted at the minimum pace directed” as a result.
USD PRICE OUTLOOK – US DOLLAR IMPLIED VOLATILITY TRADING RANGES (OVERNIGHT)
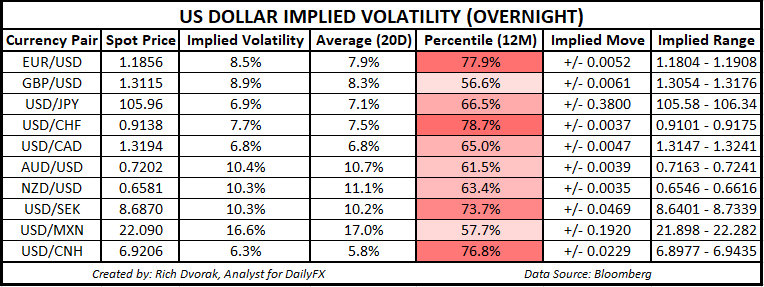
Looking forward, there could be potential for more currency volatility across major US Dollar currency pairs. The upcoming release of monthly PMI data – a leading indicator used to gauge economic activity – stands out as one scheduled event that may create turbulence for USD price action. Better-than-expected PMI readings could restore market sentiment and risk appetite, which might weigh negatively on the Greenback.
| Change in | Longs | Shorts | OI |
| Daily | -1% | -4% | -3% |
| Weekly | 4% | -10% | -5% |
Conversely, evidence that the US and global economy are stalling as the coronavirus pandemic lingers could help ignite a larger reversal by the US Dollar. Options-implied trading ranges are calculated using 1-standard deviation (i.e. 68% statistical probability price action is contained within the implied trading range over the specified time frame).
Keep Reading – Crude Oil Price Outlook Buoyed by Falling Volatility; PMIs Eyed
-- Written by Rich Dvorak, Analyst for DailyFX.com
Connect with @RichDvorakFX on Twitter for real-time market insight


