


US DOLLAR WILTS ON FED BALANCE SHEET GROWTH, DRAGHI’S LAST ECB MEETING EYED
- The US Dollar took a nosedive to intraday lows following news that the Fed will increase the daily aggregate limit on overnight repos from $75 billion to $120 billion
- USD price action could continue to edge lower as the FOMC ramps up monetary policy operations, but durable goods data and an ECB rate decision stand as more immediate threats
- Enhance your market knowledge with our free Forecasts & Trading Guides available for download
The US Dollar gyrated throughout Wednesday’s trading session while forex traders battle over the greenback’s next direction. USD price action perked up early as uncertainty surrounding ‘Brexit Limbo’ carried over from the prior day and weighed broadly on risk appetite, which likely helped bolster the US Dollar. Although, the DXY Index – a popular basket of major US Dollar currency pairs – is currently on pace to close in the red after the greenback sank sharply following reports that the FOMC gave the NY Fed the green light to raise the limit on its overnight repo operations by $45 billion.
US DOLLAR INDEX PRICE CHART: WEEKLY TIME FRAME (SEPTEMBER 18, 2017 TO OCTOBER 23, 2019)
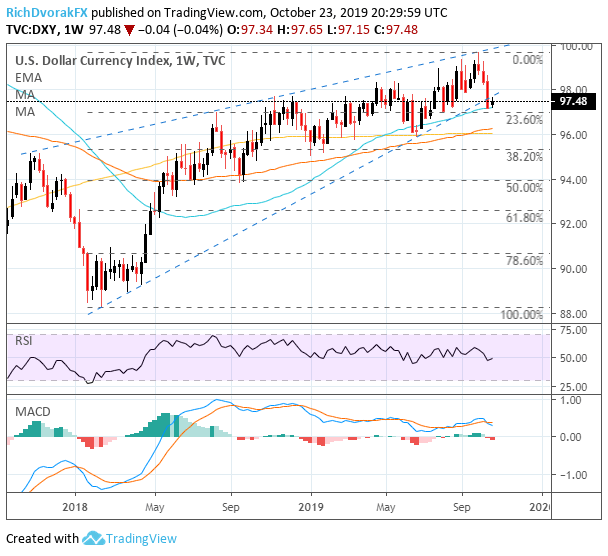
Chart created by @RichDvorakFX with TradingView
Shifting focus to the US Dollar’s technical backdrop, a weekly chart of the DXY Index brings to light the greenback’s bearish rising wedge pattern etched out since early 2018. USD price action throughout the rest of the week will stand to confirm the break below rising trend support – or conversely – indicate that the recent trendline breach is a mere “fake-out breakout.”
That said, the US Dollar enjoys confluent support nearby which is provided by its 50-week simple moving average and 23.6% Fibonacci retracement level of its trading range since last year. If this technical zone fails to keep the US Dollar afloat, the next line of defense is highlighted by the 100-week exponential moving average and 200-week SMA near the 96.00 handle.
US DOLLAR INDEX PRICE CHART: 1-MINUTE TIME FRAME (OCTOBER 23, 2019 INTRADAY)
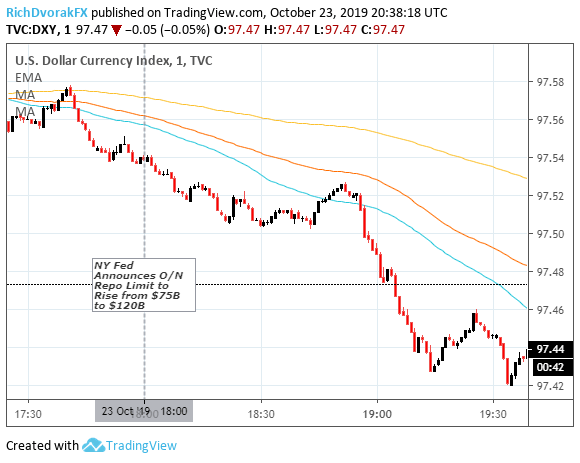
Chart created by @RichDvorakFX with TradingView
As mentioned previously, the announcement that the Federal Reserve will increase the daily aggregate limit of its overnight repo operation from $75 billion to $120 billion effective October 24 to November 14 sent the US Dollar swooning. I noted in the US Dollar Price Volatility Report published earlier this week that the Federal Reserve’s balance sheet expansion was a threat to the greenback as greater liquidity (i.e. supply of dollars) stands to drag USD price action lower. Today’s reaction to news that the FOMC plans on beefing up its repo operations underscores this plausible factor’s contribution to the US Dollar’s recent slide.
FED VS ECB BALANCE SHEET COMPARISON: EASY MONEY SPIGOT FLOWING SMOOTHLY

Furthermore, considering that EUR/USD comprises nearly 60% of the DXY Index, the direction of the most heavily traded currency pair stands to drive the US Dollar more broadly. It is worth noting that the last ECB meeting revealed the central bank’s restart of quantitative easing to the tune of EUR20 billion per month. This is widely overshadowed by the near $200 billion added to the Fed’s balance sheet since mid-September as the FOMC injects cash into markets amid recent repo market turmoil.
US DOLLAR IMPLIED VOLATILITY & TRADING RANGES (OVERNIGHT)
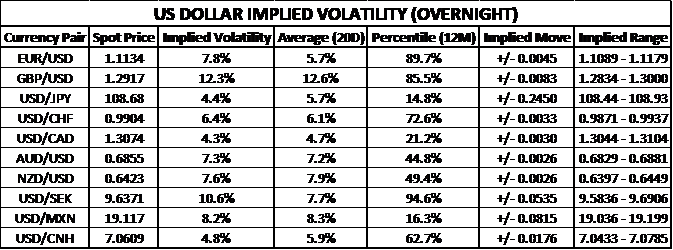
Nevertheless, US Dollar overnight implied volatility is roughly in-line with recent averages. EUR/USD is expected to be particularly volatile during Thursday’s trading session owing largely to EUR Price Volatility & ECB Rate Decisions. GBP/USD is still expected to be the most volatile major US Dollar currency pair as Brexit uncertainty lingers.
USD/JPY overnight implied volatility of 4.4% falls in the bottom 15th percentile of readings taken over the last 12-months and is also below its 20-day average of 5.7%. This seems peculiarly low ahead of high-impact event risk (listed on the DailyFX Economic Calendar) surrounding the release of September US Durable Goods Orders due Thursday at 12:30 GMT, which could materially sway FOMC interest rate cut expectations and USD price action in turn. I pointed out earlier this month that USDJPY price outlook is bearish with the prospect of more FOMC rate cuts on the horizon.
-- Written by Rich Dvorak, Junior Analyst for DailyFX.com
Connect with @RichDvorakFX on Twitter for real-time market insight


