


Gold Price Talking Points
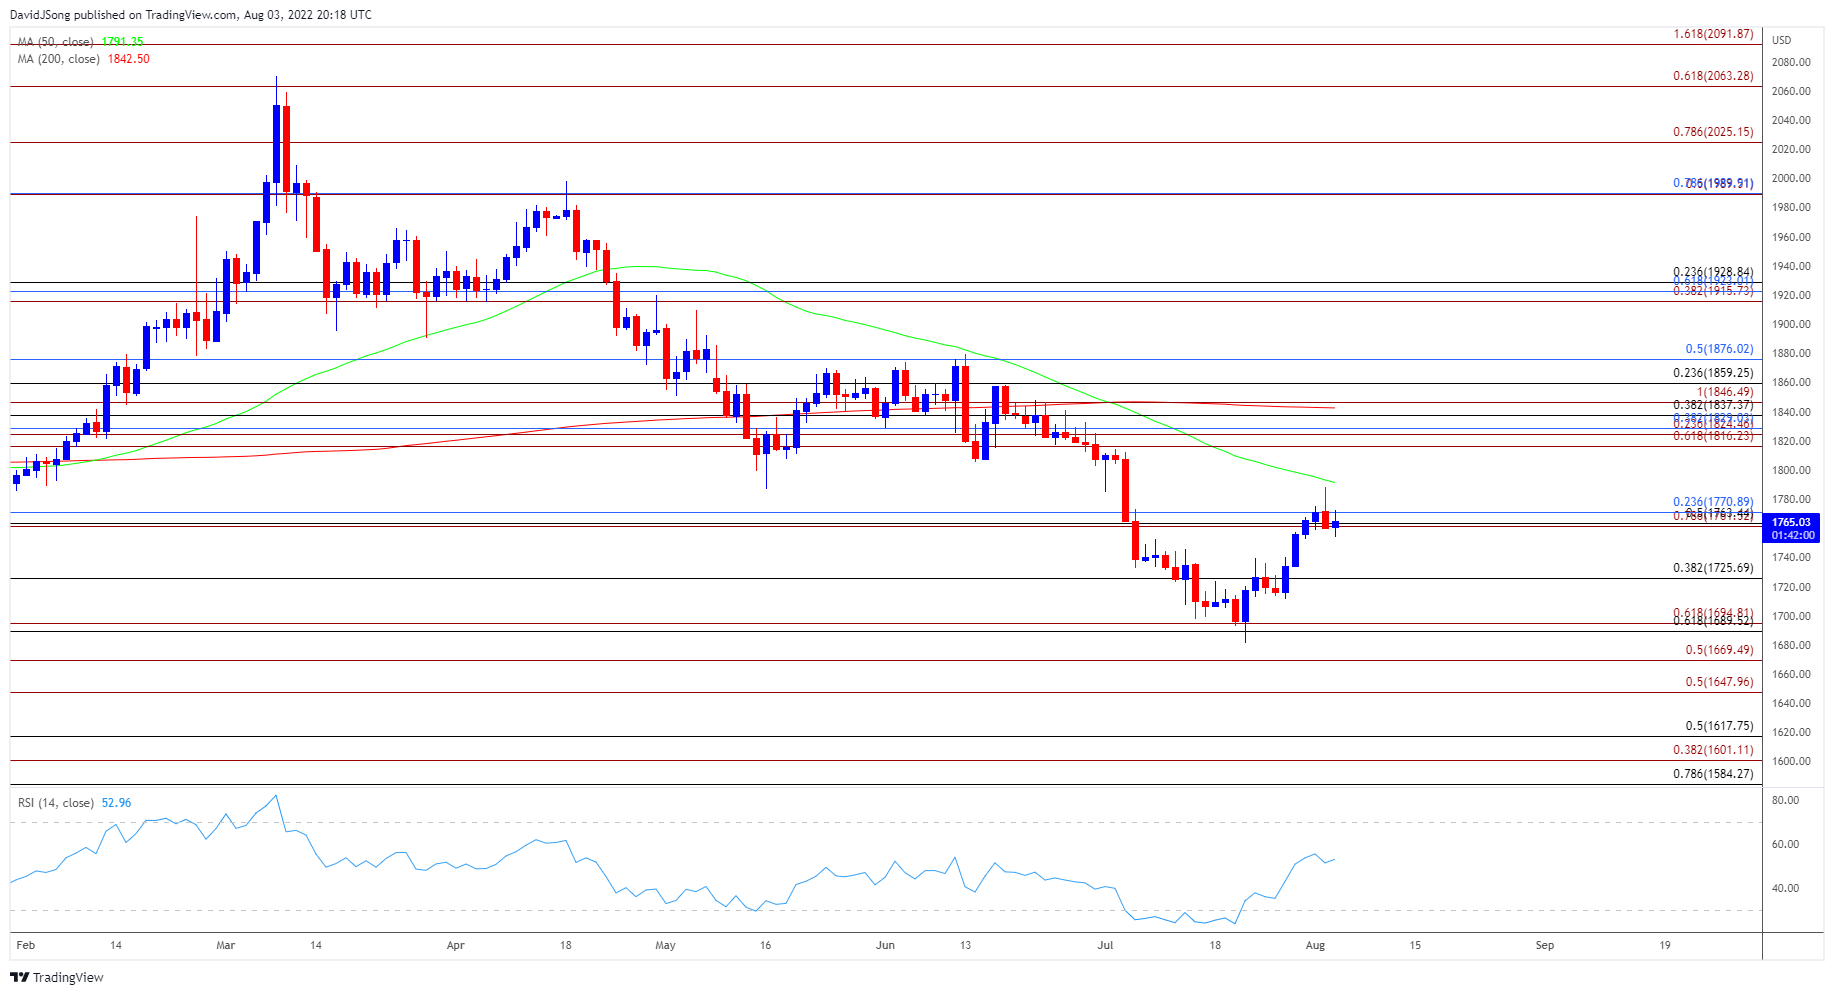
The price of gold snaps the series of higher highs and lows from last week as it pulls back from the monthly high ($1788), and the precious metal may track the negative slope in the 50-Day SMA ($1791) as it fails to push above the moving average.
Gold Price Outlook Mired by Failure to Push Above 50-Day SMA
The price of gold struggles to hold its ground following the unexpected uptick in the ISM Non-Manufacturing survey as the development wards off fears of a US recession, and bullion may face a further decline throughout the opening range for August amid the recovery in Treasury yields.
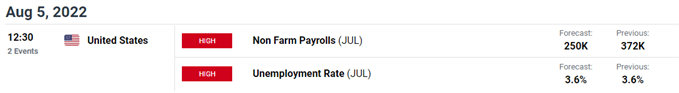
As a result, the update to the Non-Farm Payrolls (NFP) report may influence the price of gold as the US economy is expected to add 250K jobs in July, and a further improvement in the labor market may push the Federal Reserve to implement a highly restrictive policy as the central bank struggles to tame inflation.
In turn, the precious metal may largely mirror the price action from June as the rebound from the yearly low ($1681) stalls ahead of the 50-Day SMA ($1791), and the price of gold may struggle to hold its ground throughout the opening range for August as it snaps the series of higher highs and lows from last week.
With that said, the US NFP report may drag on the price of gold as a further improvement in the labor market puts pressure on the Federal Open Market Committee (FOMC) to deliver another 75bp rate hike, and the precious metal may continue to track the negative slope in the moving average as the indicator appears to be acting as resistance.
Gold Price Daily Chart
Source: Trading View
- The price of gold seems to be reversing course ahead of the 50-Day SMA ($1791) as it snaps the series of higher highs and lows from last week, and the precious metal may mirror the price action from June as it fails to push above the moving average.
- Lack of momentum to hold above the Fibonacci the overlap around $1761 (78.6% expansion) to $1771 (23.6% retracement) may push the price of gold back towards$1725 (38.2% retracement), with the next area of interest coming in around $1690 (61.8% retracement) to $1695 (61.8% expansion).
- Failure to defend the yearly low ($1681) opens up the $1670 (50% expansion) region, with the next area of interest coming in around $1648 (50% expansion).

--- Written by David Song, Currency Strategist
Follow me on Twitter at @DavidJSong


