


Gold Price Talking Points
The price of gold approaches the 50-Day SMA ($1793) as it extends the series of higher highs and lows from last week, but the precious metal may mirror the price action from June if it fails to push above the moving average.
Gold Price to Mirror June on Failure to Push Above 50-Day SMA
The recent recovery in the price of gold looks poised to persist as US Treasury yields remain under pressure, and bullion may continue to retrace the decline from the July high ($1814) as the threat of a US recession puts pressure on the Federal Reserve to implement smaller rate hikes.
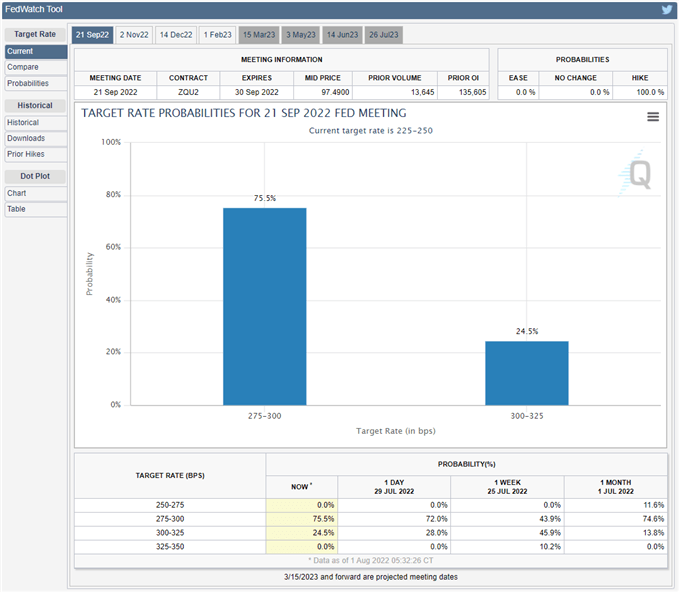
Source: CME
Speculation for a shift in Fed policy may keep the price of gold afloat as the CME FedWatch Tool now reflects a greater than 70% probability for a 50bp rate hike in September, and it remains to be seen if Chairman Jerome Powell and Co. will adjust the forward guidance for monetary policy as the central bank is slated to release the updated Summary of Economic Projections (SEP).
Until then, the price of gold may stage a larger recovery as the Federal Open Market Committee (FOMC) appears to be on track to implement higher interest rates at a slower pace, but the advance from the yearly low ($1681) may turn out to be a correction in the broader trend as the 50-Day SMA ($1793) continues to reflect a negative slope.
With that said, recent price action raises the scope for a further advance in bullion as it extends the series of higher highs and lows from last week, but the price of gold may mirror behavior from June if it fails to push above the moving average.
Gold Price Daily Chart
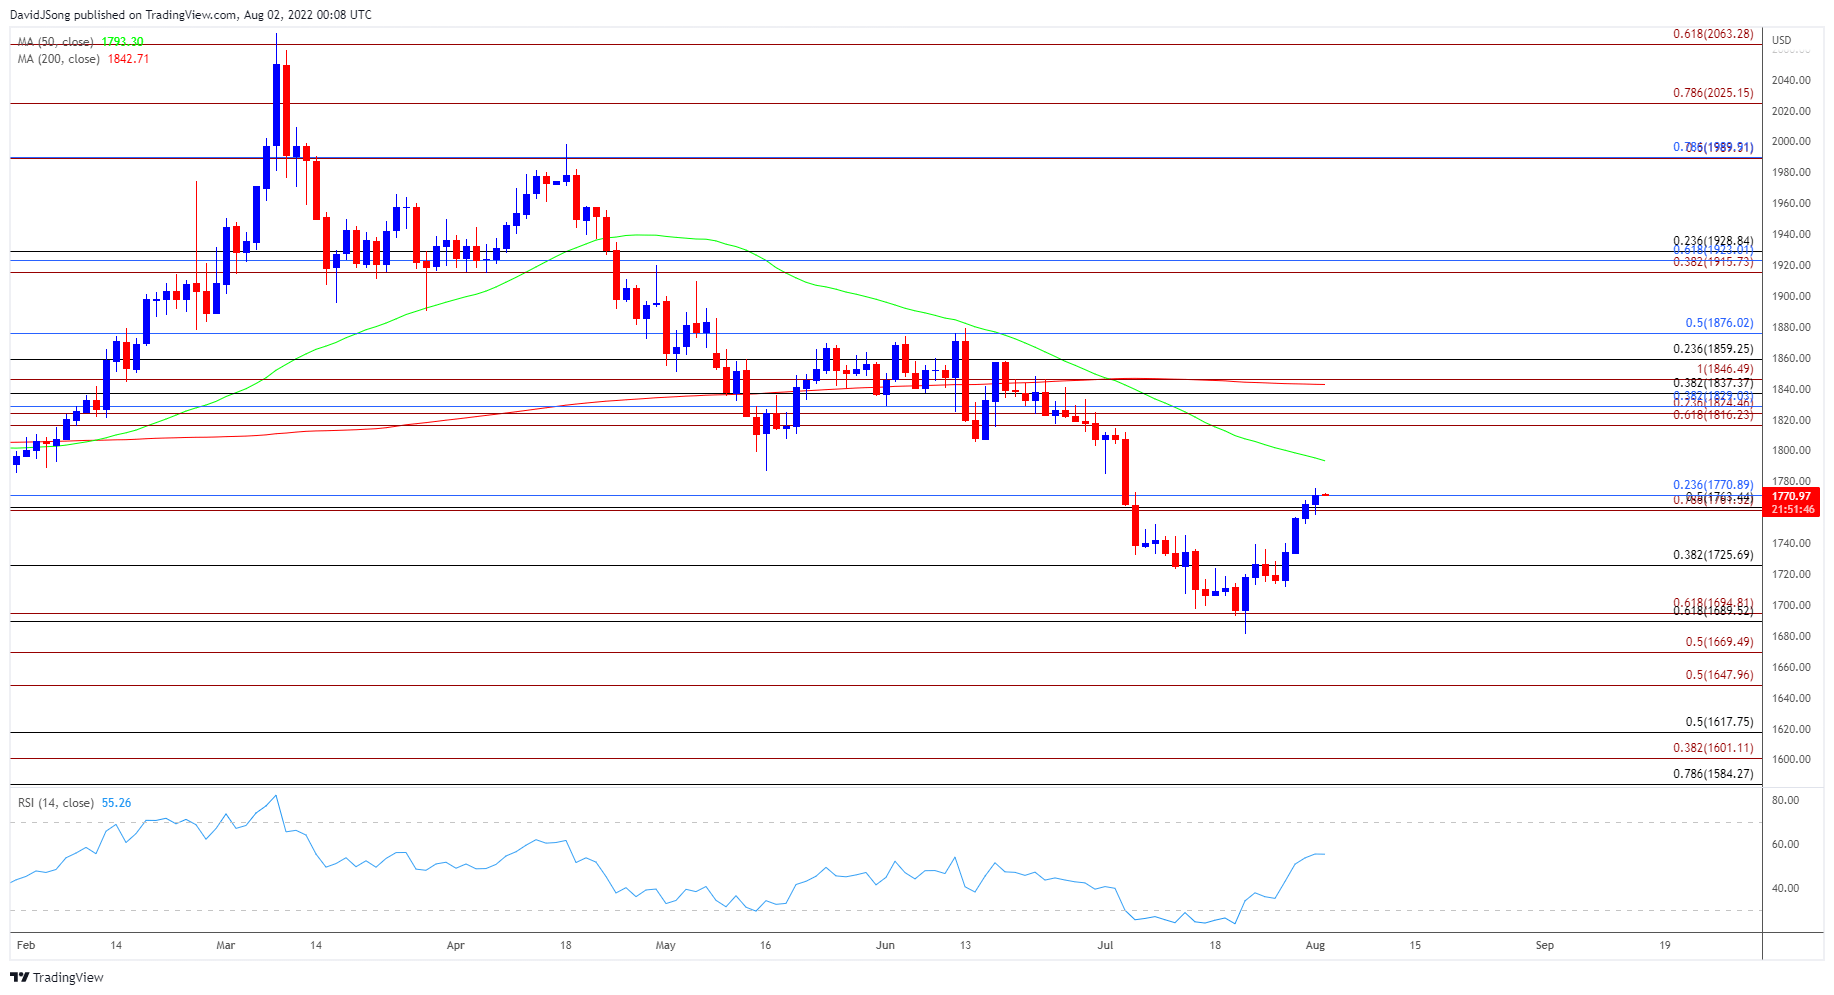
Source: Trading View
- The price of gold approaches the 50-Day SMA ($1793) after reversing ahead of the March 2021 low ($1677), with the break/close above the Fibonacci overlap around $1761 (78.6% expansion) to $1771 (23.6% retracement) bringing the $1816 (61.8% expansion) region on the radar.
- However, gold may mirror the price action from June if it fails to push above the moving average, and lack of momentum to hold above the overlap around $1761 (78.6% expansion) to $1771 (23.6% retracement) may push bullion back towards the $1725 (38.2% retracement).
- In turn, the recovery from the yearly low ($1681) may turn out to be a correction in the broader trend as the moving average continues to reflect a negative slope, with a move below $1725 (38.2% retracement) bringing the $1690 (61.8% retracement) to $1695 (61.8% expansion) region back on the radar.

--- Written by David Song, Currency Strategist
Follow me on Twitter at @DavidJSong


