


Japanese Yen Talking Points
USD/JPY slips to a fresh weekly low (127.02) amid the recent weakness in US Treasury yields, and looming developments in the Relative Strength Index (RSI) may warn of a larger pullback in the exchange rate if the oscillator falls below 70 to indicate a textbook sell signal.
Japanese Yen Forecast: USD/JPY Susceptible to RSI Sell Signal
USD/JPY bucks the US Dollar strength seen across foreign exchange markets as there appears to be a shift in investor confidence, and a further deterioration in risk appreciate may keep the exchange rate under pressure with the US stock market on the cusp of testing the yearly low.
As a result, USD/JPY may continue to carve a series of lower highs and lows over the remainder of the month as the RSI shows the bullish momentum abating, and the Bank of Japan (BoJ) interest rate decision may do little to influence the exchange rate as the central bank remains reluctant to move away from its Quantitative and Qualitative Easing (QQE) Program with Yield-Curve Control (YCC).
At the same time, the update to the US Personal Consumption Expenditure (PCE) Price Index may also generate a limited reaction as signs of sticky inflation is likely to keep the Federal Reserve on track to implement a series of rate hikes over the coming months, and the diverging paths for monetary policy may keep USD/JPY afloat as Chairman Jerome Powell and Co. expect to “begin reducing its holdings of Treasury securities and agency debt and agency mortgage-backed securities at a coming meeting.”
In turn, the decline from the yearly high (129.41) may turn out to be a correction in the broader trend as the Federal Open Market Committee (FOMC) shows a greater willingness to normalize monetary policy at a faster pace, and the tilt in retail sentiment looks poised to persist as traders have been net-short USD/JPY since late January.
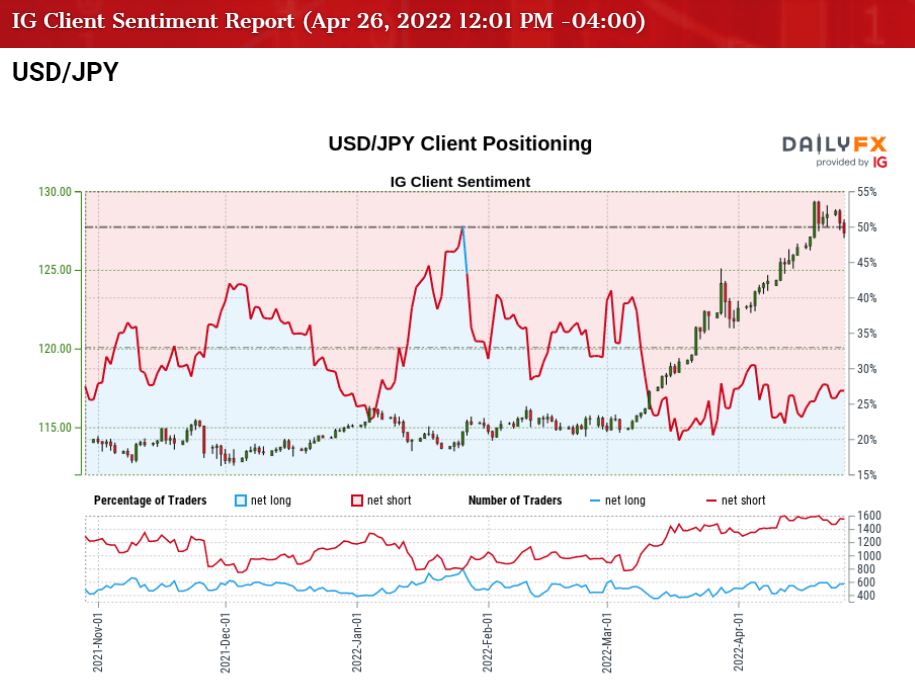
The IG Client Sentiment report shows only 24.82% of traders are currently net-long USD/JPY, with the ratio of traders short to long standing at 3.03 to 1.
The number of traders net-long is 3.85% lower than yesterday and 5.58% lower from last week, while the number of traders net-short is 2.25% higher than yesterday and 0.87% lower from last week. The decline in net-long position comes as USD/JPY slips to a fresh weekly low (127.02), while the drop in net-short interest has done little to alleviate the crowding behavior as 30.09% of traders of were net-long the pair last week.
With that said, the diverging paths between the FOMC and BoJ may keep USD/JPY afloat as market participants brace for higher US interest rates, but a move below 70 in the RSI is likely to accompany a larger pullback in the exchange rate like the price action seen during the previous month.

USD/JPY Rate Daily Chart
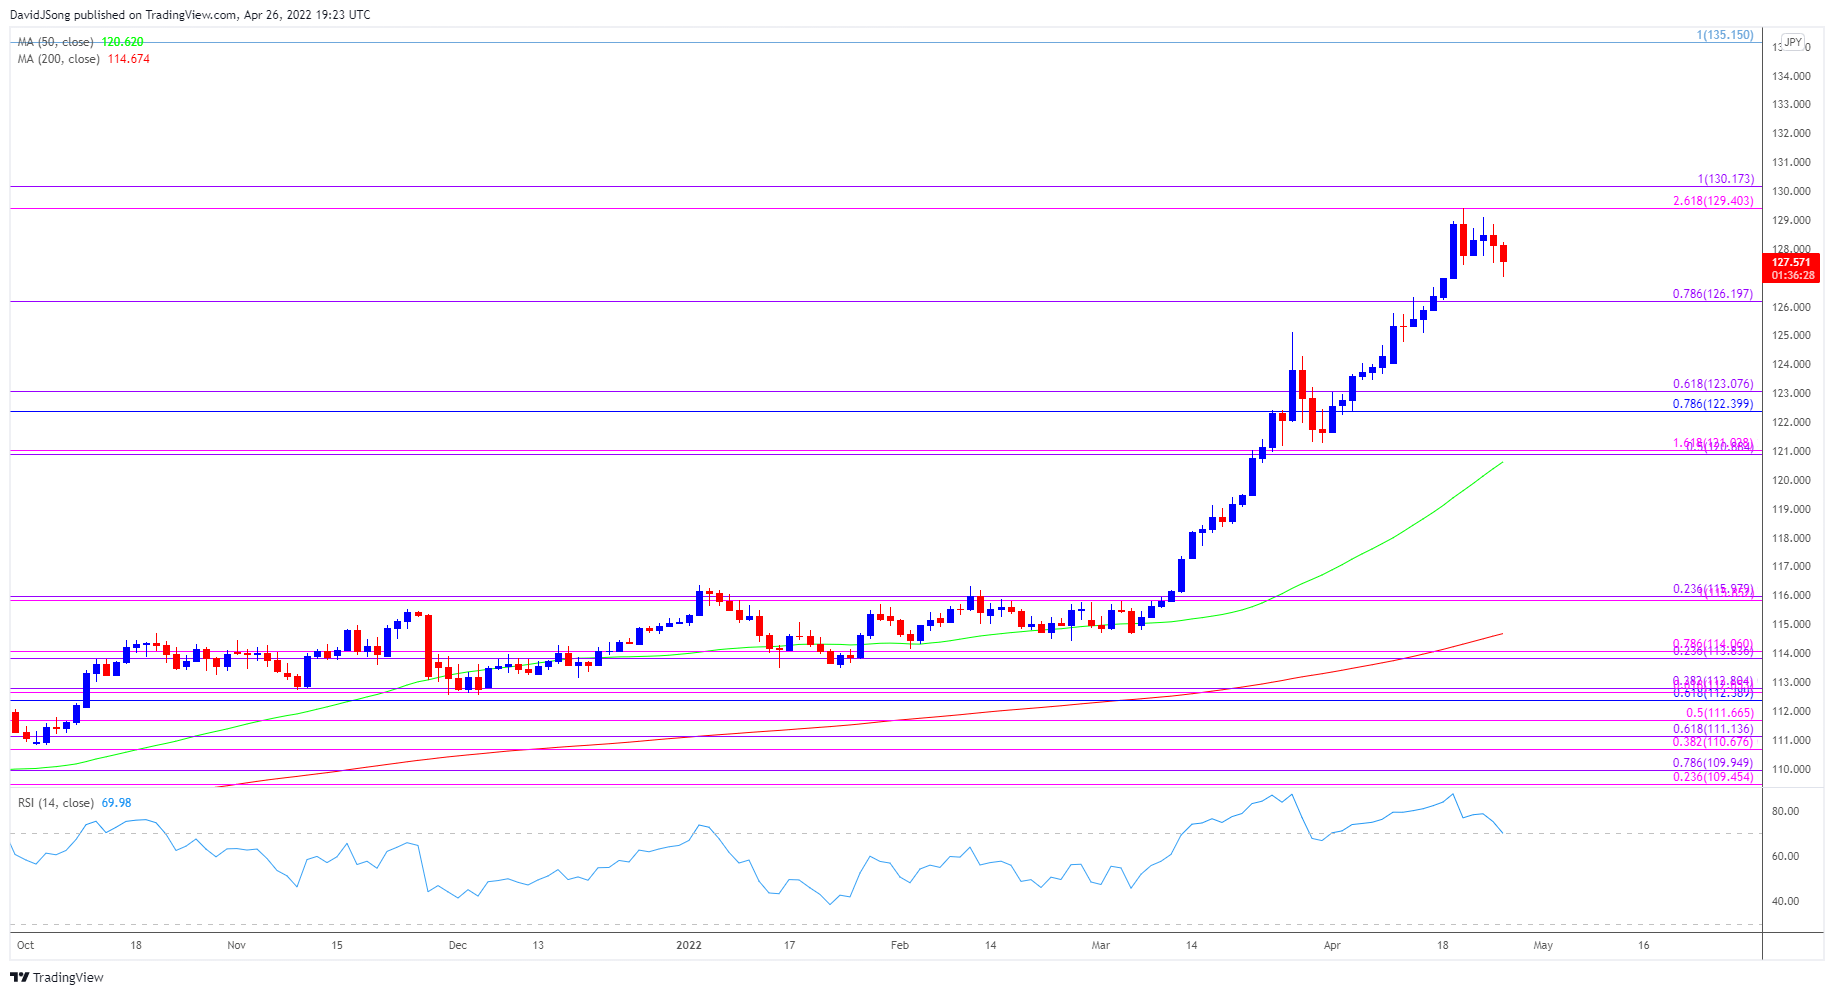
Source: Trading View
- USD/JPY cleared the May 2002 high (129.09) as it climbed to a fresh yearly high (129.41) earlier this month, but the seven-week rally appears to be unraveling amid the lack of momentum to break/close above the Fibonacci overlap around 129.40 (261.8% expansion) to 130.20 (100% expansion).
- Looming developments in the Relative Strength Index (RSI) may warn of a larger pullback in USD/JPY if the oscillator falls below 70 to indicate a textbook sell signal, with a move below the 126.20 (78.6% expansion) region bringing the 2015 high (125.86) back on the radar.
- Next area of interest comes in around 122.40 (78.6% retracement) to 123.10 (61.8% expansion) followed by the 120.90 (50% expansion) to 121.00 (161.8% expansion) region.
- Need a break/close above the overlap around 129.40 (261.8% expansion) to 130.20 (100% expansion) to bring the April 2002 high (133.82) back on the radar, with the next area of interest coming in around 135.20 (100% expansion).

--- Written by David Song, Currency Strategist
Follow me on Twitter at @DavidJSong


