


Canadian Dollar Talking Points
USD/CAD attempts to retrace the initial decline following the update to the US Consumer Price Index (CPI), but the exchange rate may continue to give back the advance from the start of the month as it struggles to trade back above the 200-Day SMA (1.2472).
USD/CAD Rate Outlook Mired by Bear Flag Formation
USD/CAD slipped to a fresh weekly low (1.2387) even as the headline US CPI reading jumped to its highest level since 1990, and the exchange rate may continue to carve a series of lower highs and lows over the coming days as it appears to be trading within a bear flag formation.
As a result, USD/CAD may face a further decline if it manages to break the opening range for November, but the larger-than-expected uptick in the US CPI seems to be curbing the recent weakness in the exchange rate as it puts pressure on the Federal Reserve to implement higher interest rates sooner rather than later.
It remains to be seen if the Federal Open Market Committee (FOMC) will react to the stickiness in inflation as the central bank is slated to update the Summary of Economic Projections (SEP) at its next interest rate decision on December 15, and a forward shift in the interest rate dot-plot may prop up US yields throughout the remainder of the year with Chairman Jerome Powell and Co. on track to winddown the emergency measures over the months ahead.
Until then, USD/CAD may continue to give back the advance from the monthly low (1.2352) as it struggles to trade back above the 200-Day SMA (1.2472), but a further decline in the exchange rate may continue to alleviate the tilt in retail sentiment like the behavior seen earlier this year.
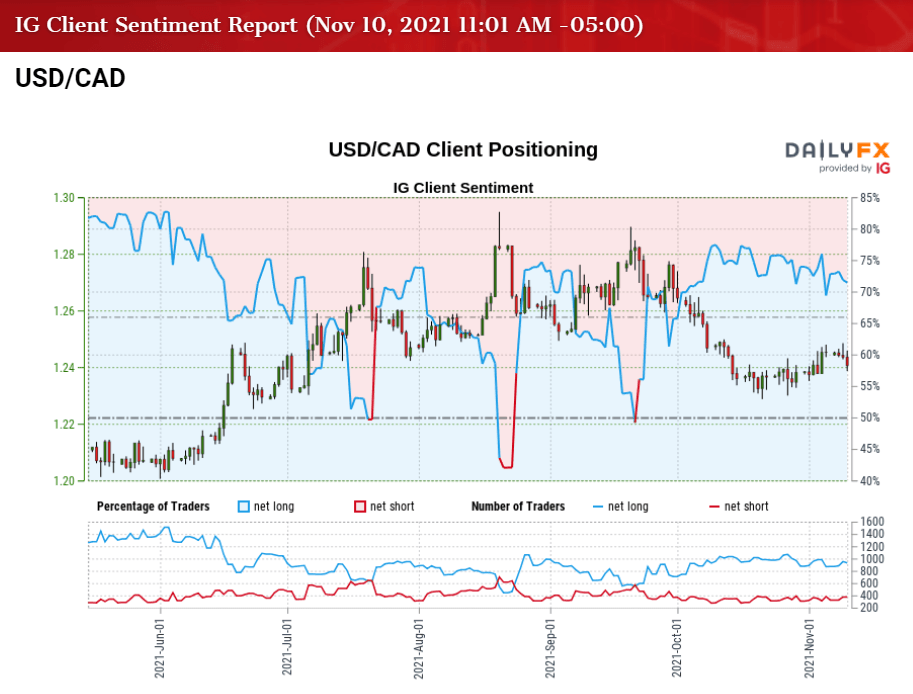
The IG Client Sentiment report shows 70.26% of traders are currently net-long USD/CAD, with the ratio of traders long to short standing at 2.36 to 1.
The number of traders net-long is 6.99% lower than yesterday and 9.95% lower from last week, while the number of traders net-short is unchanged than yesterday and 16.06% higher from last week. The decline in net-long interest has helped to alleviate the tilt in retail sentiment as 75.04% of traders were net-long USD/CAD last week, while the rise in net-short position comes as the exchange rate struggles to trade back above the 200-Day SMA (1.2472).
With that said, USD/CAD may continue to give back the advance from the start of the month as it starts to carve a series of lower highs and lows, and a bear flag formation may unfold over the coming days if the exchange rate manages to break of the opening range for November.

USD/CAD Rate Daily Chart
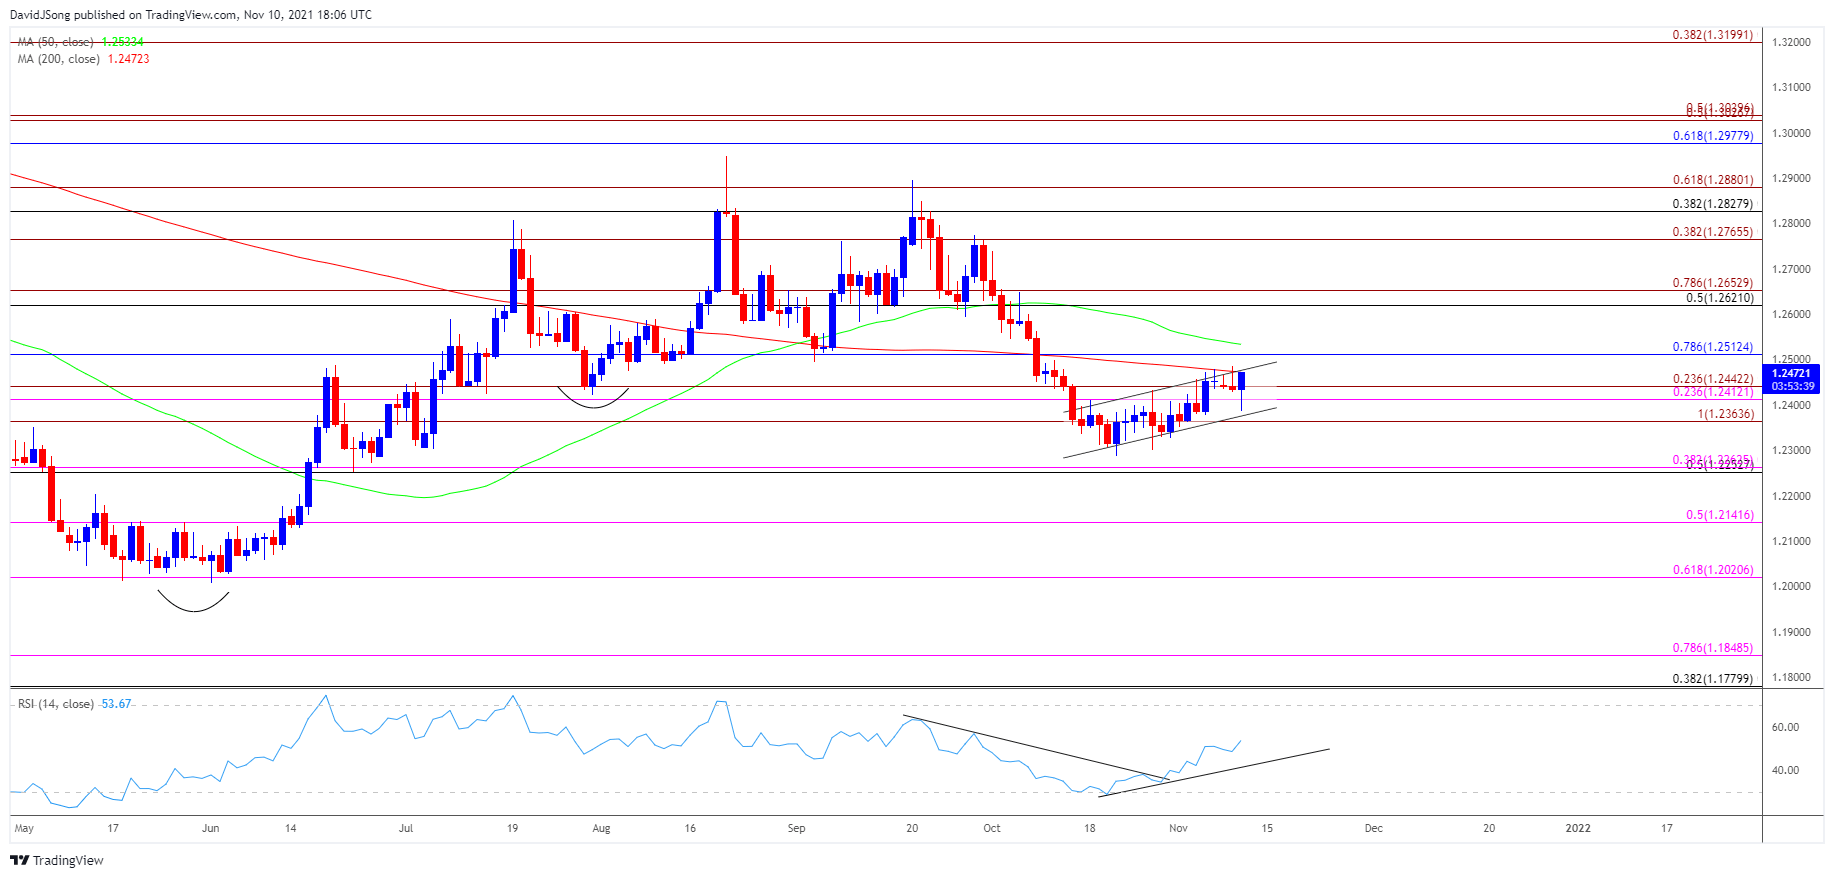
Source: Trading View
- Keep in mind, USD/CAD cleared the January high (1.2881) in August as an inverse head-and-shoulders formation took shape, with the development indicating a shift in the broader trend as the 50-Day SMA (1.2533) established a positive slope.
- However, the moving average has negated the upward trend as USD/CAD failed to take out the August high (1.2949), with the exchange rate taking out the July low (1.2303) in October as the Relative Strength Index (RSI) dipped below 30.
- In turn, a bear flag formation has taken shape a USD/CAD struggles to trade back above the 200-Day SMA (1.2472), but need a close below the Fibonacci overlap around 1.2410 (23.6% expansion) to 1.2440 (23.6% expansion) to open up the 1.2360 (100% expansion) region, which lines up with channel support.
- The continuation pattern may unfold if USD/CAD manages to take out the November low (1.2352), with a move below the October low (1.2288) bringing the 1.2250 (50% retracement) to 1.2260 (38.2% expansion) area on the radar.
- However, the bear flag formation may unravel if USD/CAD climbs above the 200-Day SMA (1.2472) to push above the 1.2510 (78.6% retracement) region, with the next area of interest coming in around 1.2620 (50% retracement) to 1.2660 (78.6% expansion).

--- Written by David Song, Currency Strategist
Follow me on Twitter at @DavidJSong


