


Japanese Yen Talking Points
USD/JPY gives back the advance from the start of the week amid the recent weakness in longer-dated US Treasury yields, and the exchange rate may face a larger pullback over the remainder of the month as the Relative Strength Index (RSI) continues to fall back from overbought territory.
USD/JPY Correction to Persist Amid Weakness in US Treasury Yields
USD/JPY tags a fresh weekly low (113.39) following the limited reaction to the smaller-than-expected decline in US Durable Goods Orders, and the exchange rate may continue to consolidate ahead of the Federal Reserve interest rate decision on November 3 as the 10-Year Treasury yield weakens for the fourth consecutive day.
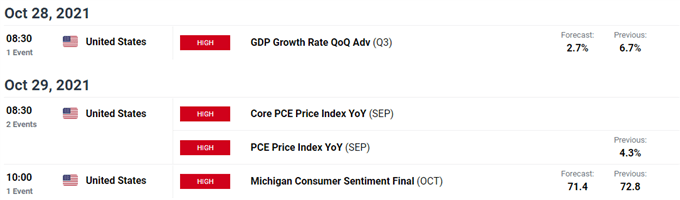
It remains to be seen if the recent US data prints will influence the Federal Open Market Committee (FOMC) as demand for large-ticket items contracts 0.4% in September versus projections for a 1.1% decline, but indications of a less robust recovery may generate a larger correction in USD/JPY as the update to the Gross Domestic Product (GDP) report is anticipated to show the growth rate rising 2.7% after expanding 6.7% in the second quarter of 2021.
As a result, a marked slowdown in the US economy may produce headwinds for the Dollar as it puts pressure on the Fed to delay its exit strategy, but a positive development may generate a bullish reaction in USD/JPY as the FOMC plans to scale back is purchases of Treasury securities and mortgage-back securities (MBS) later this year.
In turn, the pullback from the monthly high (114.70) may turn out to be a correction in the broader trend amid the deviating paths between the Fed and Bank of Japan (BoJ), but a further decline in USD/JPY may continue to alleviate the tilt in retail sentiment like the behaver seen earlier this year.
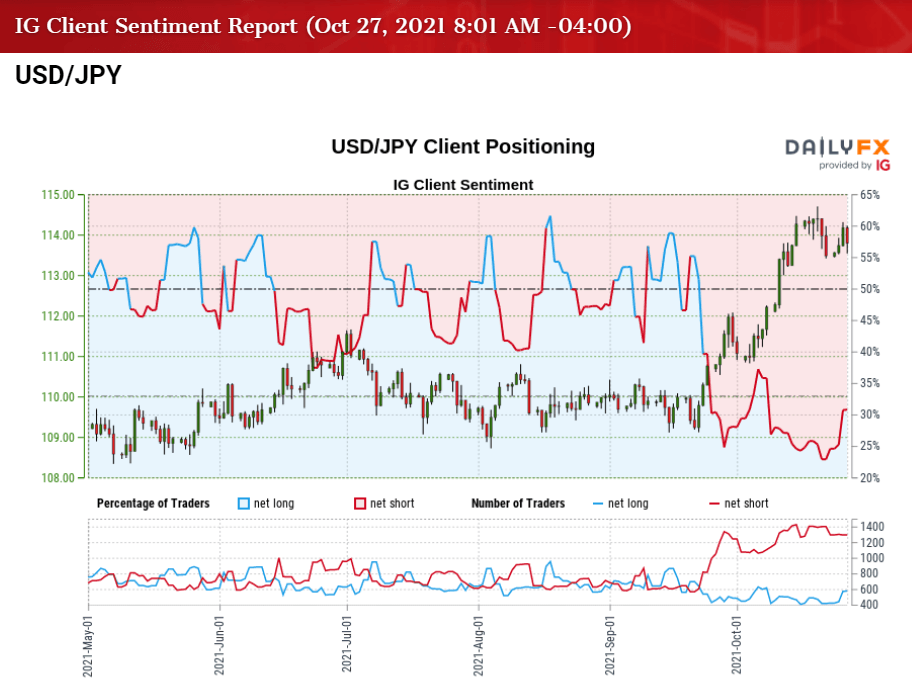
The IG Client Sentiment report shows 27.68% of traders are currently net-long USD/JPY, with the ratio of traders short to long standing at 2.61 to 1.
The number of traders net-long is 16.96% lower than yesterday and 5.94% lower from last week, while the number of traders net-short is 6.97% lower than yesterday and 8.35% lower from last week. The decline in net-long position comes as USD/JPY tags a fresh weekly low (113.39), while the drop in net-short interest has helped to alleviate the tilt in retail sentiment as only 23.07% of traders were net-long the pair last week.
With that said, USD/JPY may continue to consolidate ahead of the next Fed rate decision amid the weakness in longer-dated US yields, and recent developments in the Relative Strength Index (RSI) raises the scope for a further decline in the exchange rate as the indicator falls back from overbought territory to reflect a textbook sell signal.

USD/JPY Rate Daily Chart

Source: Trading View
- The broader outlook for USD/JPY remains constructive as it trades to fresh yearly highs in the second half of 2021, with the 200-Day SMA (109.30) indicating a similar dynamic as it retains the positive slope from earlier this year.
- The Relative Strength Index (RSI) showed a similar dynamic as it pushed into overbought territory for the first time since the first quarter of 2021, but recent developments warn of a larger pullback in USD/JPY as the oscillator falls back from overbought territory to offer a textbook sell signal.
- In turn, USD/JPY appears to have reversed course ahead of the November 2017 high (114.74), and lack of momentum to climb back above the Fibonacci overlap around 113.80 (23.6% expansion) to 114.30 (23.6% retracement) keeps the 112.40 (61.8% retracement) to 112.80 (38.2% expansion) region on the radar as the bullish momentum appears to be abating.
- Next area of interest comes in around 111.10 (61.8% expansion) to 111.60 (38.2% retracement), which lines up with the 50-Day SMA (111.21), followed by the 109.40 (50% retracement) to 110.00 (38.2% expansion) region.

--- Written by David Song, Currency Strategist
Follow me on Twitter at @DavidJSong


