


Canadian Dollar Talking Points
USD/CAD holds above the 50-Day SMA (1.2577) following the kneejerk reaction to Canada’s Employment report, and recent price action raises the scope for a near-term advance in the exchange rate as it clears the opening range for September.
USD/CAD Forecast: Inverse Head-and-Shoulders Pattern Takes Shape
The Canadian Dollar may continue to depreciate against its US counterpart as recent data prints indicate a slowing recovery in Canada, and USD/CAD may continue to retrace the decline from the August high (1.2949) as the Bank of Canada (BoC) “judges that the Canadian economy still has considerable excess capacity, and that the recovery continues to require extraordinary monetary policy support.”
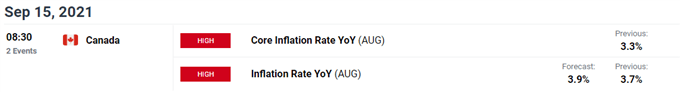
It remains to be seen if the update to Canada’s Consumer Price Index (CPI) will sway the BoC as the headline reading for inflation is expected to widen to 3.9% from 3.7% per annum in July, but signs of stronger price growth may trigger a bullish reaction in the Canadian Dollar as it encourages the central bank to scale back monetary support. At the same time, a weaker-than-expected CPI print may prop up USD/CAD as the Governor Tiff Macklem and Co. insist that the “factors pushing up inflation are expected to be transitory,” and the break above the January high (1.2881) may continue to reflect a change in the broader trend as the 50-Day SMA (1.2577) now reflects a positive slope.
In turn, USD/CAD may continue to appreciate ahead of the next BoC meeting on October 27 as a growing number of Federal Reserve officials show a greater willingness to switch gears, but a further advance in the exchange rate may continue to temper the tilt in retail sentiment like the behavior seen earlier this year.
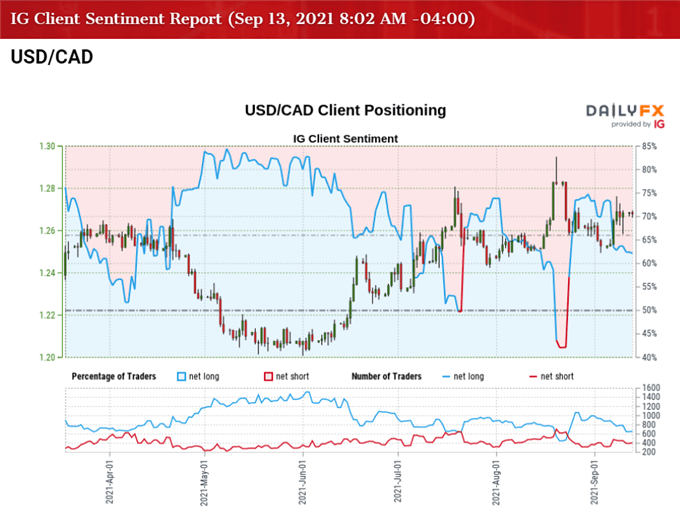
The IG Client Sentiment report shows 61.17% of traders are currently net-long USD/CAD, with the ratio of traders long to short stand at 1.58 to 1.
The number of traders net-long is 14.44% higher than yesterday and 21.81% lower from last week, while the number of traders net-short is 15.46% higher than yesterday and 44.41% higher from last week. The drop in net-long position comes as USD/CAD clears the opening range for September, while the surge in net-short interest has helped to alleviate the crowding behavior as 74.00% of traders were net-long the pair at the end of August.
With that said, the break above the January high (1.2881) may continue to reflect a change in the broader trend as an inverse head-and-shoulders pattern takes shape, and decline from the August high (1.2949) may turn out to be a near-term correction as the 50-Day SMA (1.2577) now reflects a positive slope.

USD/CAD Rate Daily Chart
Source: Trading View
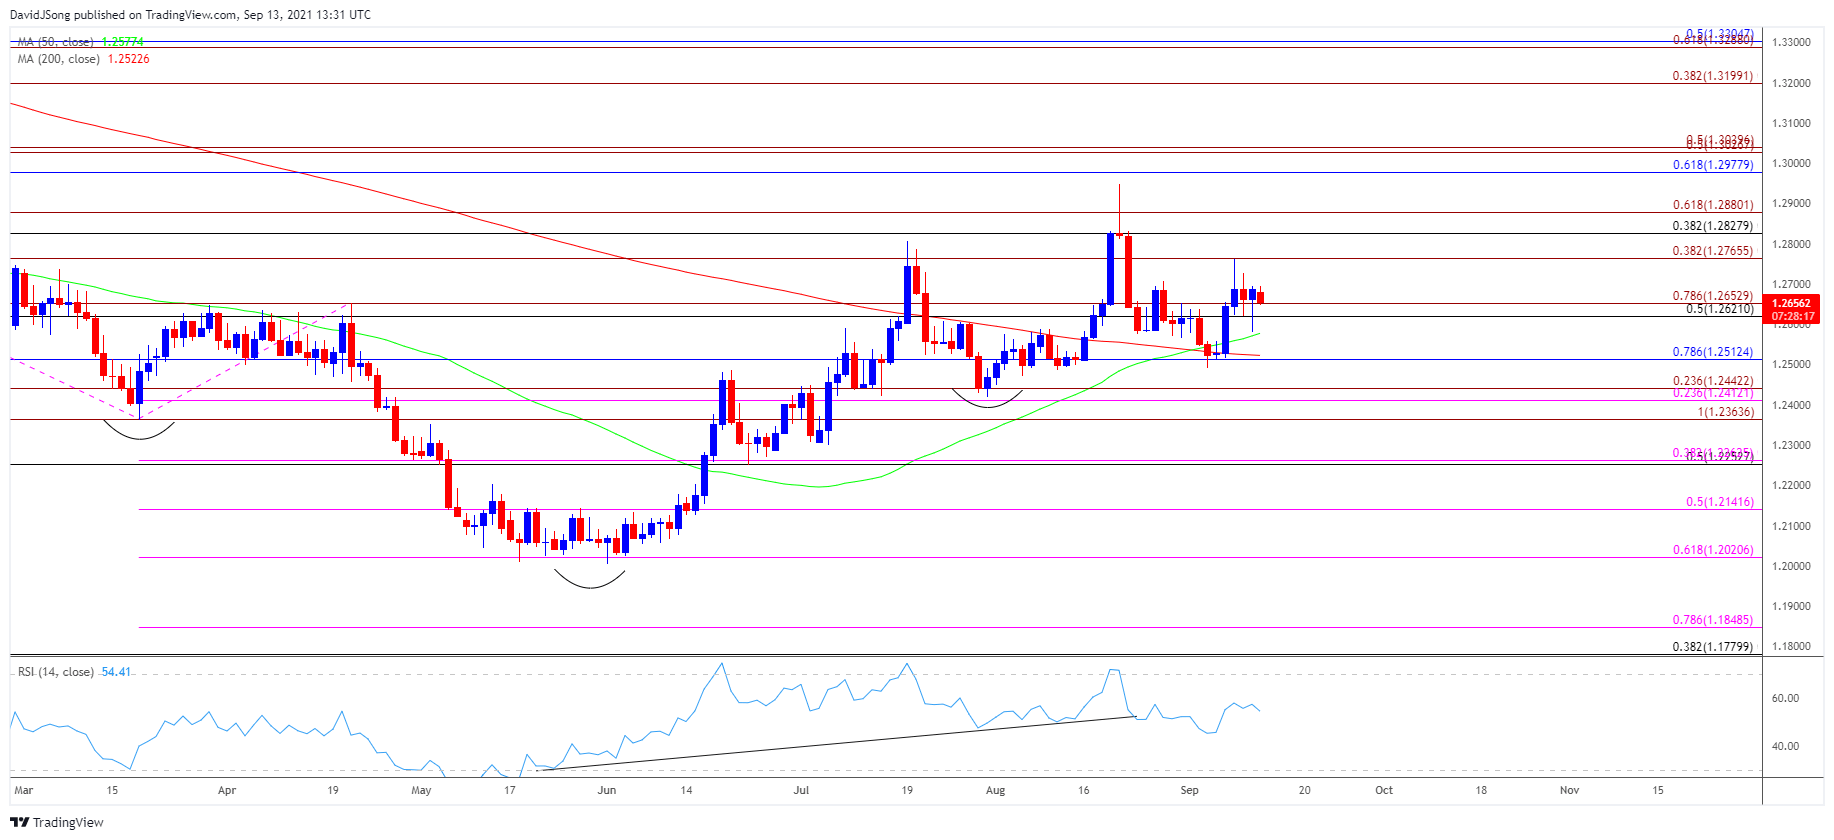
- The break above the January high (1.2881) indicates a shift in the broader trend as an inverse head-and-shoulders formation takes shape, with the 50-Day SMA (1.2577) now reflecting a positive slope as USD/CAD trades to fresh yearly highs in August.
- In turn, the pullback from the August high (1.2949) may end up being short lived as USD/CAD trade back above the 50-Day SMA (1.2577), but need a break/close above the 1.2770 (38.2% expansion) region to open up the Fibonacci overlap around 1.2830 (38.2% retracement) to 1.2880 (61.8% expansion).
- A break above the August high (1.2949) brings the 1.2980 (61.8% retracement) region on the radar, with the next area of interest coming in around 1.3030 (50% expansion) to 1.3040 (50% expansion).
- However, failure to hold above the 1.2620 (50% retracement) to 1.2650 (78.6% expansion) region may push USD/CAD back below the 50-Day SMA (1.2577), with the next area of interest coming in around .12510 (78.6% retracement).

--- Written by David Song, Currency Strategist
Follow me on Twitter at @DavidJSong


