


Canadian Dollar Talking Points
USD/CAD extends the advance following the Bank of Canada (BoC) interest rate decision to trade above the 200-Day SMA (1.2626) for the first time in a year, with recent developments in the Relative Strength Index (RSI) indicating a further appreciation in the exchange rate as the oscillator climbs above 70 to push into overbought territory.
USD/CAD Rally Sends RSI Into Overbought Zone for Second Time in 2021
USD/CAD climbs to a fresh monthly high (1.2808) amid headlines that the Biden administration is considering changes to the United States-Mexico-Canada Agreement (USMCA), and fresh data prints coming out of the Canada may keep the exchange rate afloat as household spending is expected to contract for the second month.

Canada Retail Sales are projects to fall 3.0% in May after declining 5.7% the month prior, and a dismal development may produce headwinds for the Canadian Dollar as it limits the BoC’s scope to wind down its emergency measures. In turn, the BoC may revert to a wait-and-see approach as “the Bank now expects GDP growth of around 6 percent in 2021 – a little slower than was expected in April,” and Governor Tiff Macklem and Co. may merely attempt to buy time at the next interest rate decision on September 8 as “decisions regarding further adjustments to the pace of net bond purchases will be guided by Governing Council's ongoing assessment of the strength and durability of the recovery.”
Until then, USD/CAD may continue to retrace the decline from the January high (1.2881) as it trades above the 200-Day SMA (1.2626) for the first time in a year, with the weakness in the Canadian Dollar spurring a shift in retail sentiment as traders flip net-short for the first time in 2021.
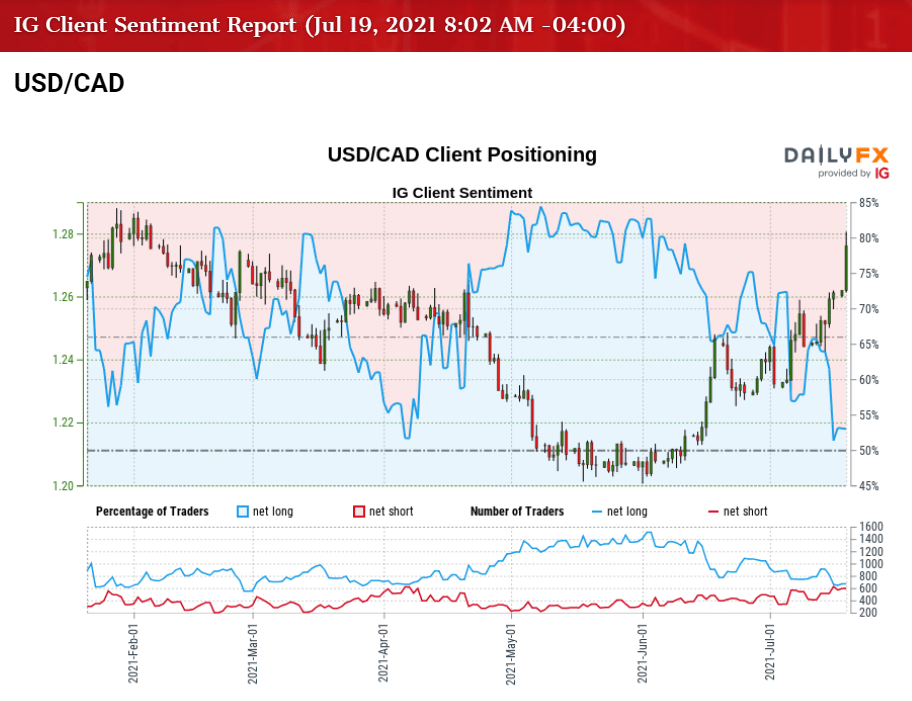
The IG Client Sentiment report shows 48.71% of traders are currently net-long USD/CAD, with the ratio of traders short to long standing at 1.05 to 1.
The number of traders net-long is 11.03% lower than yesterday and 33.15% lower from last week, while the number of traders net-short is 3.58% higher than yesterday and 41.56% higher from last week. The sharp decline in net-long position could be a function of profit-taking behavior as USD/CAD climbs to a fresh monthly high (1.2808), while the jump in net-short interest has fueled the shift in retail sentiment as 66.79% of traders were net-long the pair at the start of last week.
With that said, the rebound from the yearly low (1.2007) may turn out to be a change in the broader trend amid the shift in retail sentiment, and the overbought reading in the RSI is likely to be accompanied by a further advance in USD/CAD like the behavior seen during the previous month.

USD/CAD Rate Daily Chart
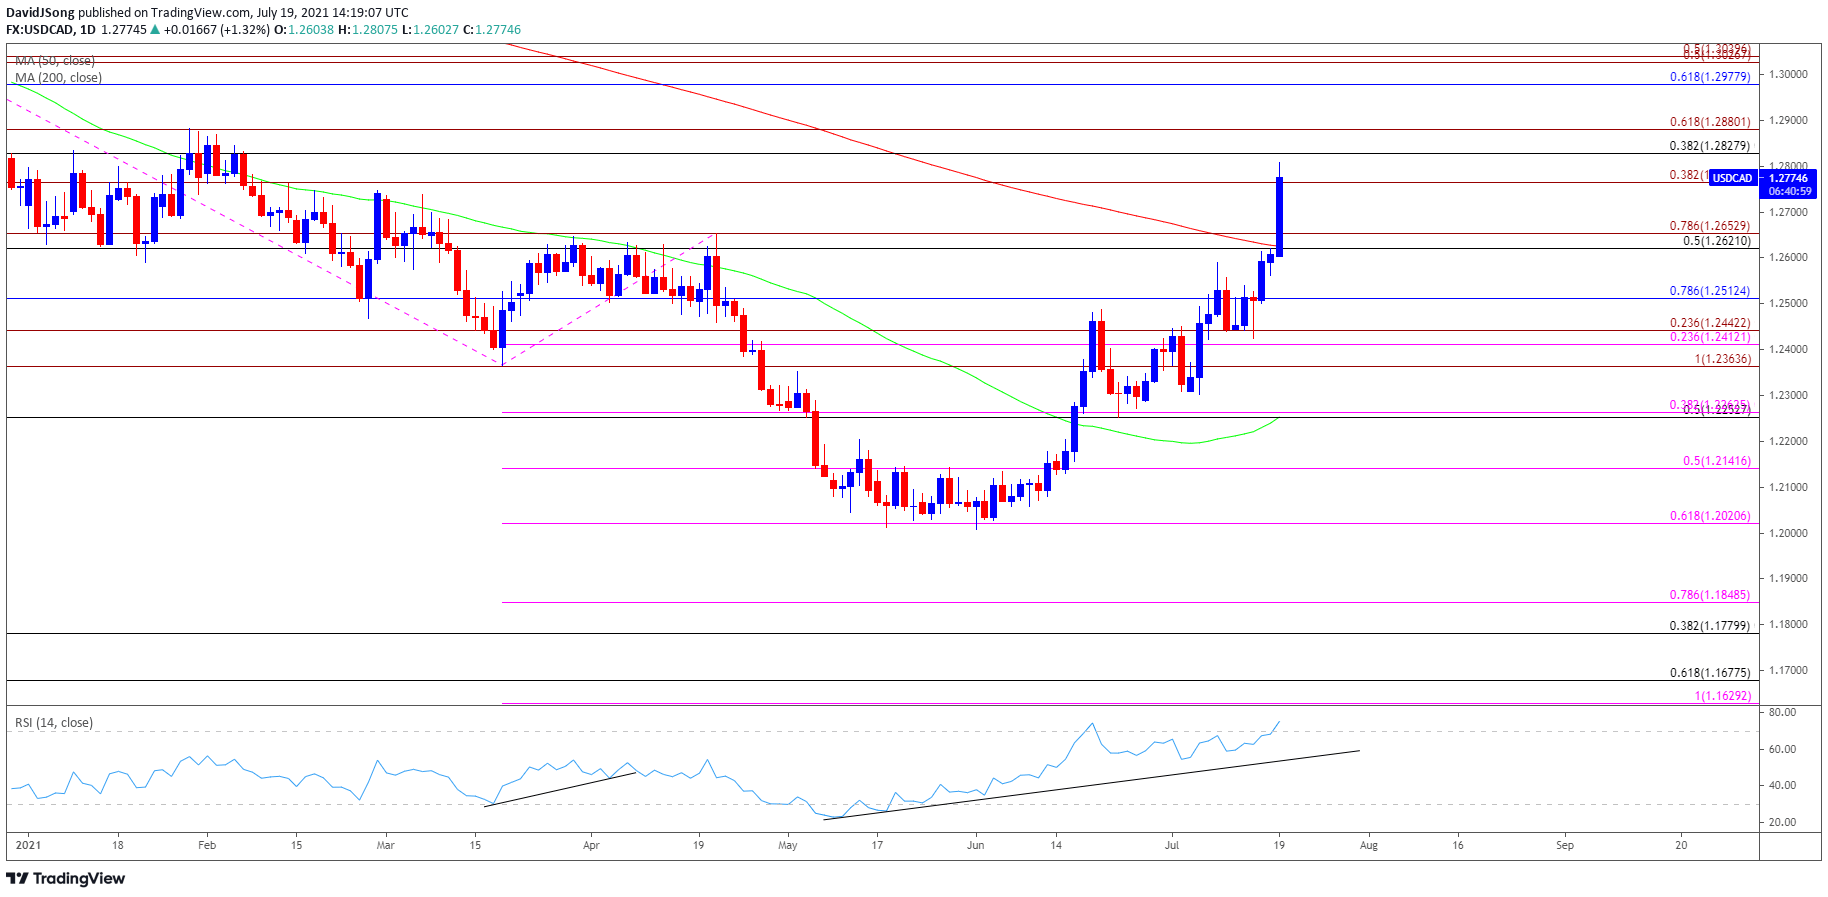
Source: Trading View
- The negative slope in the 200-Day SMA (1.2625) indicates a bearish outlook for USD/CAD, but the rebound from the yearly low (1.2007) may turn out to be a change in the broader trend as it trades above the moving average for the first time since July 2020.
- Recent developments in the Relative Strength Index (RSI) indicate a similar dynamic as the oscillator pushes into overbought territory for the second time in 2021, with the move above 70 likely to be accompanied by a further advance in USD/CAD like the behavior seen during the previous month.
- In turn, USD/CAD appears to be on track to test the January high (1.2881), but need a close above the 1.2770 (38.2% expansion) region to bring the Fibonacci overlap around 1.2830 (38.2% retracement) to 1.2880 (61.8% expansion) on the radar.
- Next area of interest comes in around 1.2980 (61.8% retracement) followed by the 1.3030 (50% expansion) to 1.3040 (50% expansion) region.

--- Written by David Song, Currency Strategist
Follow me on Twitter at @DavidJSong


