
Japanese Yen Talking Points
USD/JPY searches for support as the exchange rate fails to retain the opening range for April, and the bullish momentum may continue to abate as the Relative Strength Index (RSI) snaps the upward trend from earlier this year.
USD/JPY Snaps April Opening Range as Bearish Price Series Takes Shape
USD/JPY appears to have reversed course following the failed attempt to test the March 2020 high (111.72), with the exchange rate trading to a fresh monthly low (108.75) as it extends the series of lower highs and lows from earlier this week.
The bearish price sequence may push USD/JPY towards the 50-Day SMA (107.79) amid the recent weakness in longer-dated US Treasury yields, and fresh remarks from Federal Reserve officials may do little to shore up the Dollar as the central bank appears to be in no rush to switch gears.
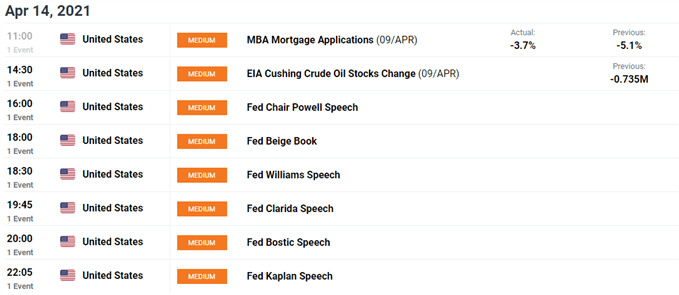
Recent remarks from Chairman Jerome Powell suggests the Federal Open Market Committee (FOMC) will continue to utilize its emergency tools in 2021 as the central bank head argues that “it's highly unlikely we would raise rates anything like this year,” and a wave of dovish comments may keep USD/JPY under pressure if Fed officials show a greater willingness to address the broader rise longer-dated US Treasury via ‘Operation Twist.’
In turn, it remains to be seen if the decline from the March high (110.97) will turn out to be a correction or a change in trend as a ‘golden cross’ takes shape in 2021, but it seems as though the recent shift in retail sentiment may end up being short lived as the net-short bias dissipates.
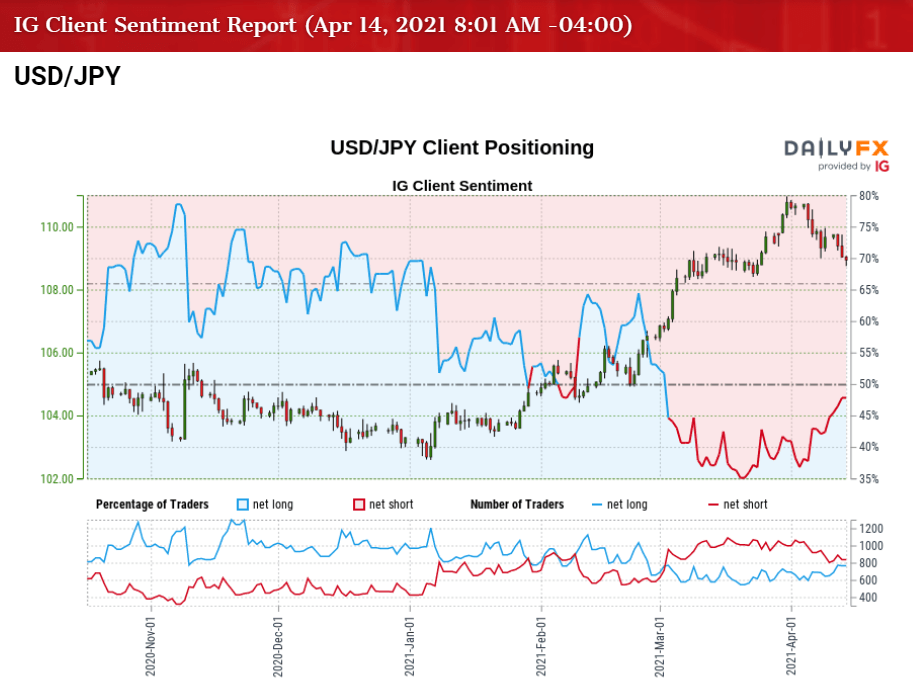
The IG Client Sentiment report shows 47.48% of traders are net-long with the ratio of traders short to long at 1.11 to 1.
The number of traders net-long is 1.56% lower than yesterday and 3.28% higher from last week, while the number of traders net-short is 6.07% lower than yesterday and 10.79% lower from last week. The rise in net-long position has helped to reverse the recent shift in retail sentiment as only 43.85% of traders were net-long USD/JPY during the previous week, while the decline in net-short position could be a function of profit-taking behavior as the exchange rate trades to a fresh monthly low (108.75).
With that said, the USD/JPY rally may continue unravel as the flip in retail sentiment dissipates, and the recent series of lower highs and lows may push the exchange rate towards the 50-Day SMA (107.79) as the Relative Strength Index (RSI) snaps the upward trend from earlier this year.

USD/JPY Rate Daily Chart
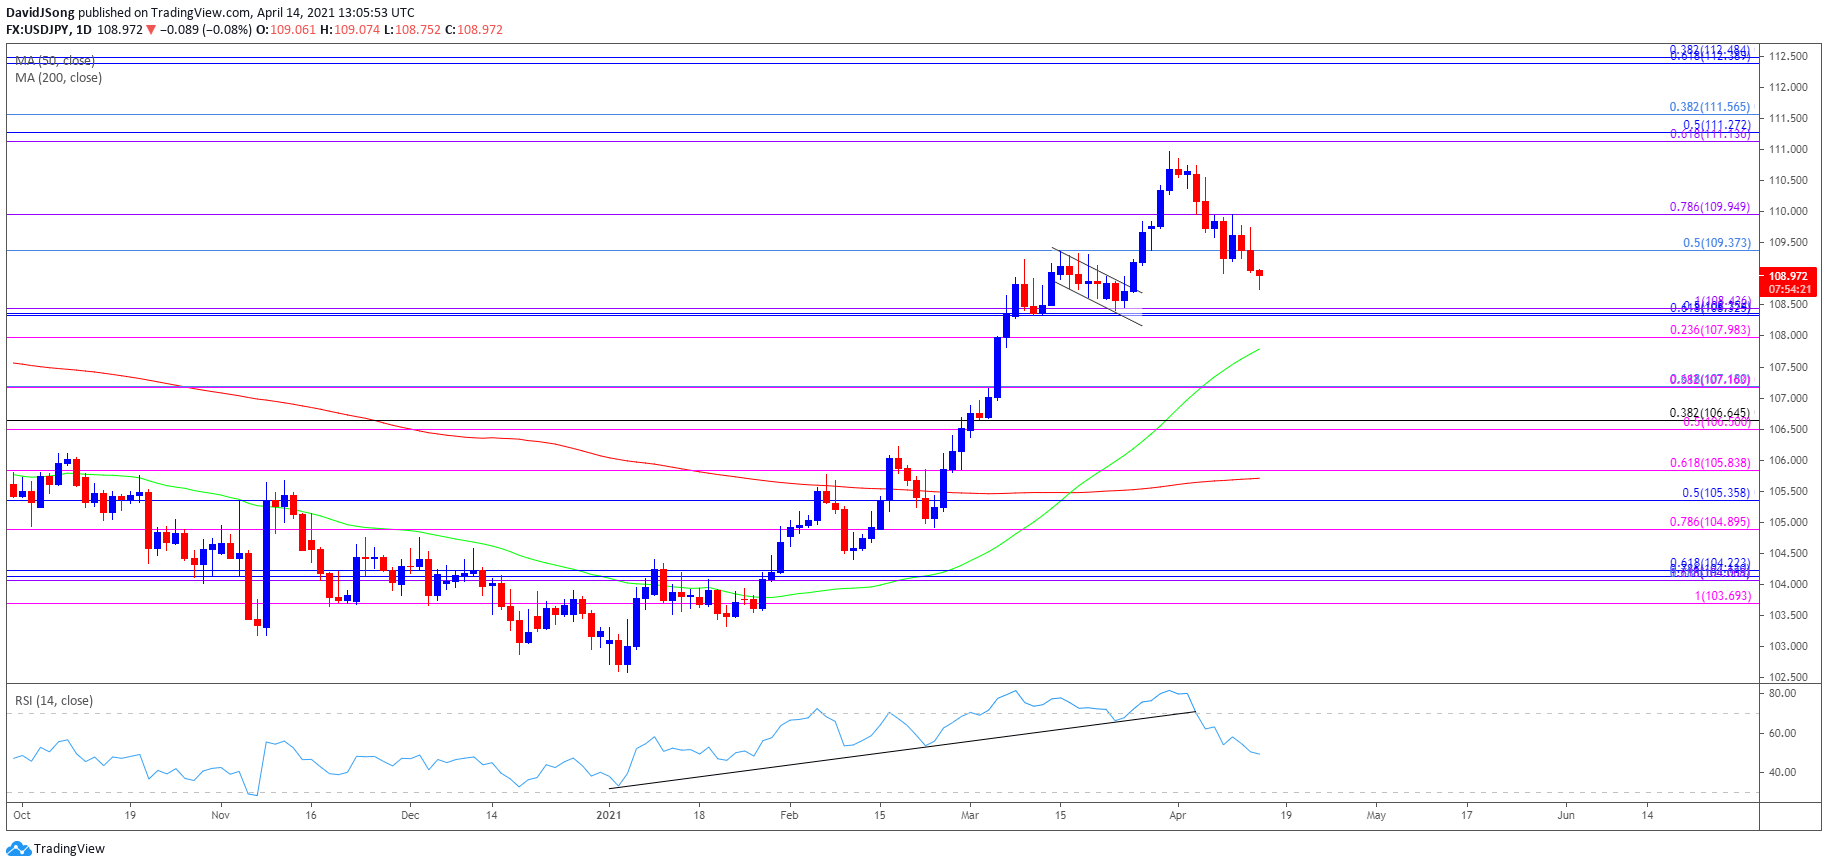
Source: Trading View
- USD/JPY approached pre-pandemic levels as a ‘golden cross’ materialized in March, with a bull flag formation unfolding during the same period as the exchange rate traded to fresh yearly highs.
- The Relative Strength Index (RSI) showed a similar dynamic as the indicator climbed above 70 for the first time since February 2020, but recent developments in the oscillator raises the scope for a larger correction in USD/JPY as it falls back from overbought territory to snap the upward trend established at the start of the year.
- In turn, USD/JPY appears to have reversed course following the failed attempt to test the March 2020 high (111.72), with the recent series of lower highs and lows bringing the Fibonacci overlap around 108.00 (23.6% expansion) to 108.40 (100% expansion) on the radar, which sits just above the 50-Day SMA (107.79).
- Next area of interest comes in around 107.20 (61.8% expansion) followed by the overlap around 106.50 (50% expansion) to 106.70 (38.2% retracement).

--- Written by David Song, Currency Strategist
Follow me on Twitter at @DavidJSong