


Gold Price Talking Points
The price of gold appears to have carved a double bottom as it breaks out of the downward trend from earlier this year, but lack of momentum to test the March high ($1760) instills a bearish outlook as it carves a fresh series of lower highs and lows.
Gold Bearish Price Series Emerges amid Failure to Test March High
The price of gold extends the decline from the end of last week amid the recent rebound in longer-dated US Treasury yields, and the failed attempts to push above the 50-Day SMA ($1756) may bring the March low ($1677) on the radar as the moving average tracks the negative slope from earlier this year.
It remains to be seen if the broader recovery in US Treasury yields will persist as Federal Reserve Chairman Jerome Powell highlights the risk of reopening the economy too quickly, with the central bank head going onto say that “it's just a very unusual recovery” during an interview with 60 Minutes.
As a result, Chairman Powell insists that the Federal Open Market Committee (FOMC) would “consider raising rates when the labor market recovery is essentially complete and we're back to maximum employment and inflation is back to our 2% goal and is on track to move above 2% for some time.” The comments from Chairman Powell suggest the FOMC will retain the current policy at its next interest rate decision on April 28 as “it's highly unlikely we would raise rates anything like this year,” but the Fed may gradually alter the forward guidance over the coming months as “we find ourselves really at an inflection point where the economy, we think, is going to start to recover much more quickly.”
Until then, the swings in US Treasury yields may sway the price of gold as Chairman Powell states that “some asset prices are elevated by some historical metrics,” and the decline from record high ($2075) may continue to underscore a change in trend as a ‘death cross’ formation takes shape in 2021.
With that said, lack of momentum to test the March high ($1760) may keep bullion within a definedrange, and the failed attempts to push above the 50-Day SMA ($1756) may bring the March low ($1677) on the radar as the price of gold carves a fresh series of lower highs and lows.
Gold Price Daily Chart
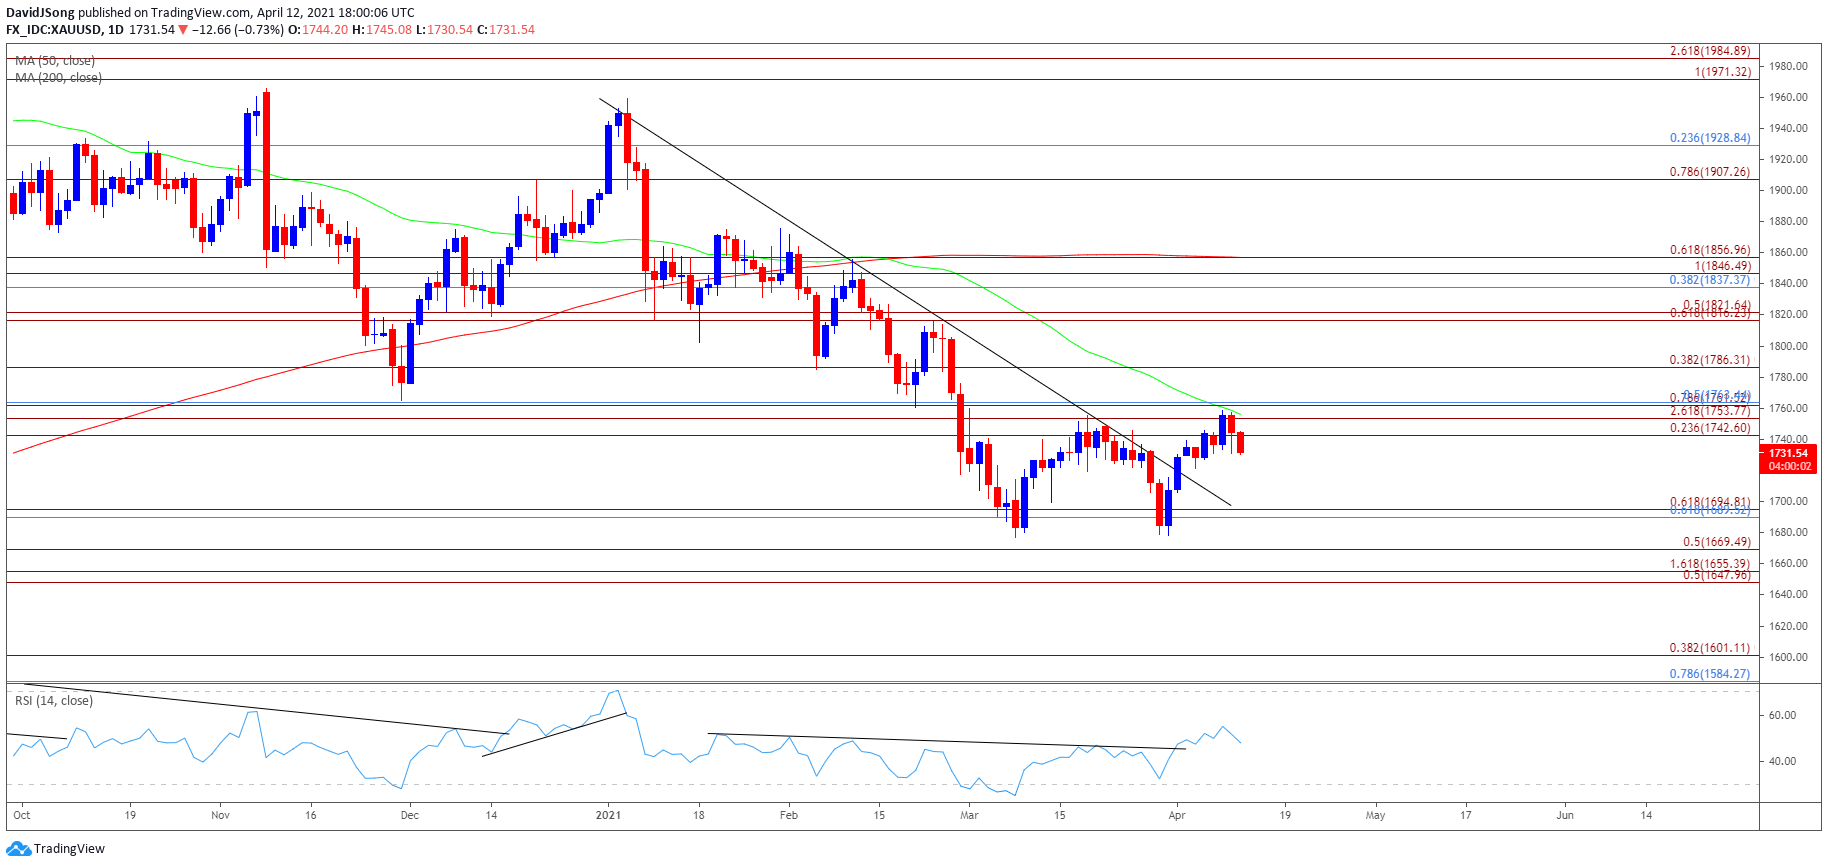
Source: Trading View
- Keep in mind, the price of gold pushed to fresh yearly highs throughout the first half 2020, with the bullish price action also taking shape in August as the precious metal tagged a new record high ($2075).
- However, the bullish behavior failed to materialize in September as the price of gold traded below the 50-Day SMA ($1772) for the first time since June, with developments in the Relative Strength Index (RSI) negating the wedge/triangle formation established in August as the oscillator slipped to its lowest level since March.
- Since then, the decline from the record high ($2075) indicates a potential shift in market behavior as the RSI dipped into oversold territory for the first time since 2018, with a ‘death cross’ formation taking shape earlier this year as the 50-Day SMA ($1756) developed a negative slope.
- However, a double bottom appears to have taken take after failing to test the June 2020 low ($1671) as the price of gold breaks out of the downward trend from the start of the year, with a break/close above the $1743 (23.6% expansion) to $1763 (50% retracement) zone bringing the $1786 (38.2% expansion) region on the radar.
- Nevertheless, lack of momentum to test the March high ($1760) may generate a larger pullback in the price of gold as it appears to be capped by the 50-Day SMA ($1756), with the recent series of lower highs and lows raising the scope for a move towards the Fibonacci overlap around $1690 (61.8% retracement) to $1695 (61.8% expansion).

--- Written by David Song, Currency Strategist
Follow me on Twitter at @DavidJSong


