


Canadian Dollar Talking Points
USD/CAD extends the advance from the monthly low (1.2365) as the US Dollar gains on the back of waning investor confidence, but lack of momentum to push back above the 50-Day SMA (1.2644) may keep the exchange rate within the March range like the price action from earlier this month.
USD/CAD to Track Monthly Range Amid Failure to Hold Above 50-Day SMA
USD/CAD attempts to trade back above the 50-Day SMA (1.2644) as the 10-Year Treasury yield climbs to a fresh yearly high (1.77%), and key developments coming out of the US may continue to prop up the exchange rate as Non-Farm Payrolls (NFP) are projected to increase for the third consecutive month.
Current market forecasts show the US economy adding 639K jobs in March, while the Unemployment Rate is expected to narrow to 6.0% from 6.2% the month prior. A further improvement in the labor market may spark a bullish reaction in the US Dollar as it encourages the Federal Reserve to further upgrade its economic outlook, but it remains to be seen if the Federal Open Market Committee (FOMC) will adjust the forward guidance later this year as Governor Lael Brainard warns that “the K-shaped labor market recovery remains uneven across racial groups, industries, and wage levels.”
In turn, the FOMC may stay on course to “increase our holdings of Treasury securities by at least $80 billion per month and of agency mortgage-backed securities by at least $40 billion per month” as the central bank lays out an outcome based approach for monetary policy, and the advance from the monthly low (1.2365) may turn out to be a correction in the broader trend rather than a shift in USD/CAD behavior as the crowding behavior from 2020 persists.
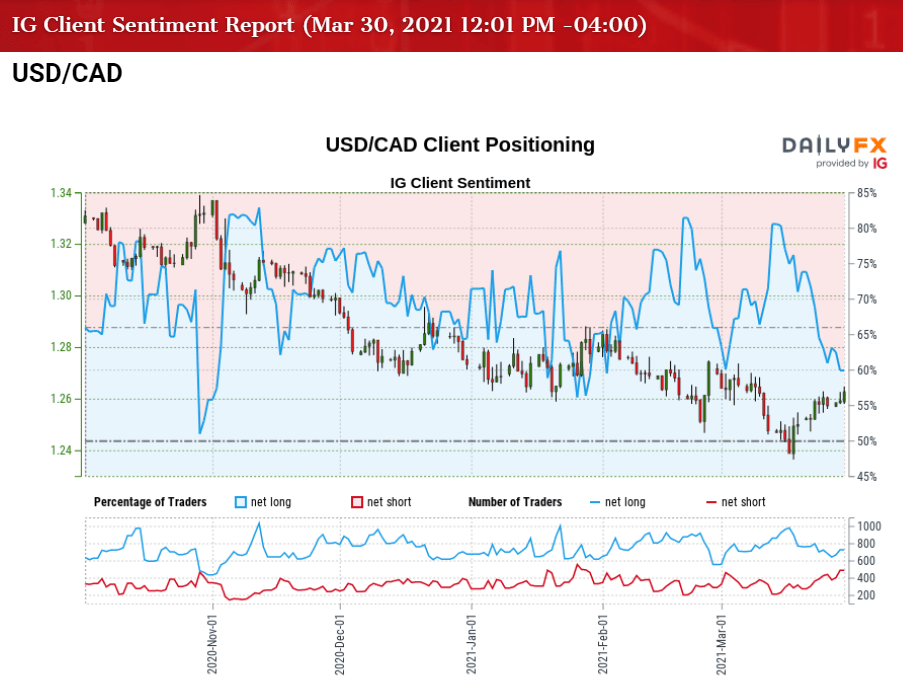
Retail traders have been net-long USD/CAD since May 2020, with the IG Client Sentiment report showing 60.77% of traders currently net-long the pair as the ratio of traders long to short stands at 1.55 to 1.
The number of traders net-long is 2.55% lower than yesterday and 4.61% lower from last week, while the number of traders net-short is 5.26% lower than yesterday and 22.83% higher from last week. The decline in net-long position could be a function of profit taking behavior as USD/CAD breaks out of a narrow range, while the rise in net-short position has done little to alleviate the tilt in retail sentiment as 59.70% of traders were net-long the pair during the previous week.
With that said, lack of momentum to push back above the 50-Day SMA (1.2644) may keep USD/CAD within the monthly range, and the exchange rate may consolidate ahead of the NFP report if former support now acts as resistance.

USD/CAD Rate Daily Chart
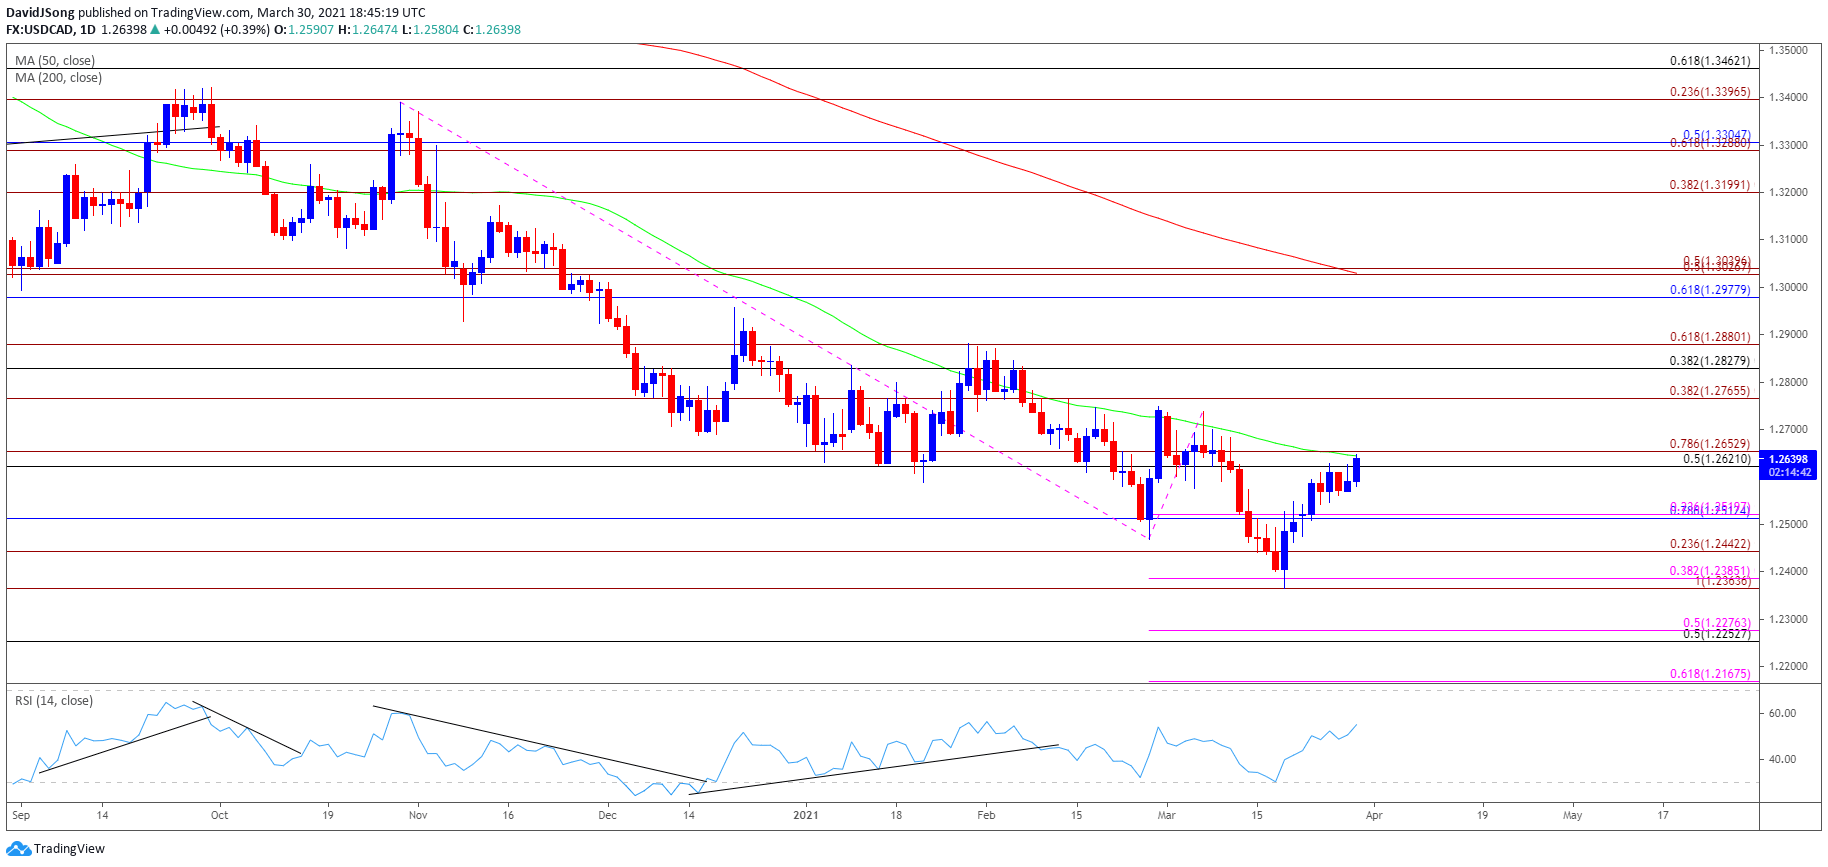
Source: Trading View
- Keep in mind, USD/CAD cleared the January 2020 low (1.2957) following the US election, with the exchange rate trading to fresh yearly lows in November and December as the Relative Strength Index (RSI) established a downward trend during the same period.
- USD/CAD started off 2021 by taking out last year’s low (1.2688) even though the RSI broke out of the bearish formation, with lack of momentum to hold above the 1.2770 (38.2% expansion) region pushing the exchange rate briefly below the Fibonacci overlap around 1.2620 (50% retracement) to 1.2650 (78.6% expansion).
- A break/close below the Fibonacci overlap around 1.2620 (50% retracement) to 1.2650 (78.6% expansion) materialized in February, which pushed USD/CAD to fresh 2021 lows, with a similar scenario taking shape in March following the break/close below the 1.2510 (78.6% retracement) region.
- Lack of momentum to break/close below the 1.2360 (100% expansion) to 1.2390 (38.2% expansion) area has pushed USD/CAD back towards the former support zone around 1.2620 (50% retracement) to 1.2650 (78.6% expansion), which largely lines up with the 50-Day SMA (1.2644), but the rebound from the monthly low (1.2365) may end up being short lived if the former support zone now acts as resistance.
- Lack of momentum to push back above the 50-Day SMA (1.2644) may send USD/CAD back towards the Fibonacci overlap around 1.2250 (50% retracement) to 1.2280 (50% expansion), with the next area of interest coming in around 1.2440 (23.6% expansion).
- Need a break/close below the 1.2440 (23.6% expansion) region to open up the 1.2360 (100% expansion) to 1.2390 (38.2% expansion) area, which lines up with the monthly low (1.2365).

--- Written by David Song, Currency Strategist
Follow me on Twitter at @DavidJSong


