


Canadian Dollar Talking Points
USD/CAD attempts to retrace the decline following the Federal Reserve interest rate decision as the US 10-Year Treasury yield climbs to a fresh yearly (1.75%), but the exchange rate may continue to exhibit the bearish behavior seen in 2020 as it trades to fresh yearly lows in March.
USD/CAD Forecast: Bearish Price Series Persists Following Dovish FOMC
USD/CAD extends the series of lower highs and lows carried over from the previous week as a majority of Fed officials see the benchmark interest rate sitting near zero through 2023, and it looks as though key market themes will remain in place as the Federal Open Market Committee (FOMC) stays on track to “increase our holdings of Treasury securities by at least $80 billion per month and of agency mortgage-backed securities by at least $40 billion per month.”
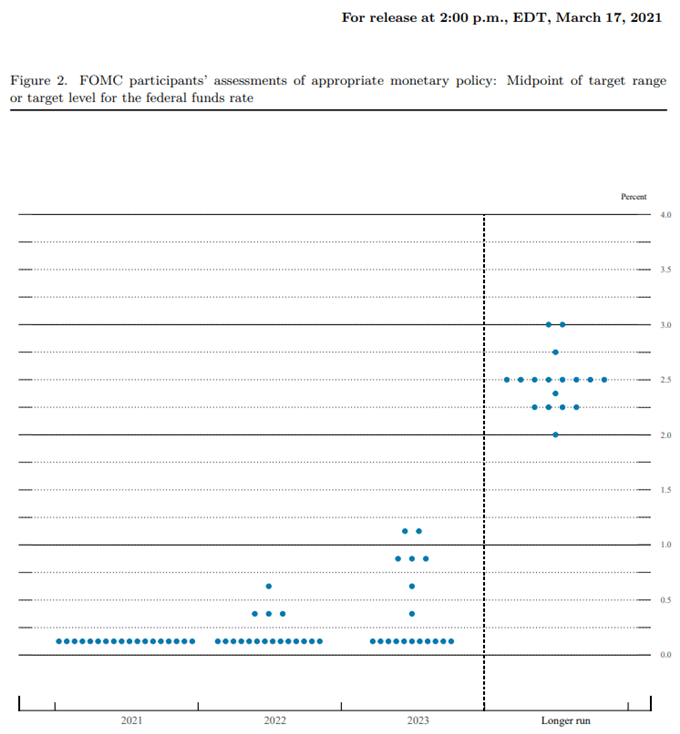
Source: FOMC
Despite the minor revisions in the interest rate dot plot, the FOMC appears to be in no rush to switch gears as “employment is 9.5 million below its pre-pandemic level,” and the central bank may continue to strike a dovish tone at its next interest rate decision on April 28 as Chairman Jerome Powell emphasizes that “our guidance is outcome based and ties the path of the federal funds rate and the balance sheet to progress toward reaching our employment and inflation goals.”
Until then, USD/CAD may continue to exhibit the bearish behavior seen in 2020 as it trades to fresh yearly lows in March, but the tilt in retail sentiment looks poised to persist as traders have been net-short the pair since May 2020.
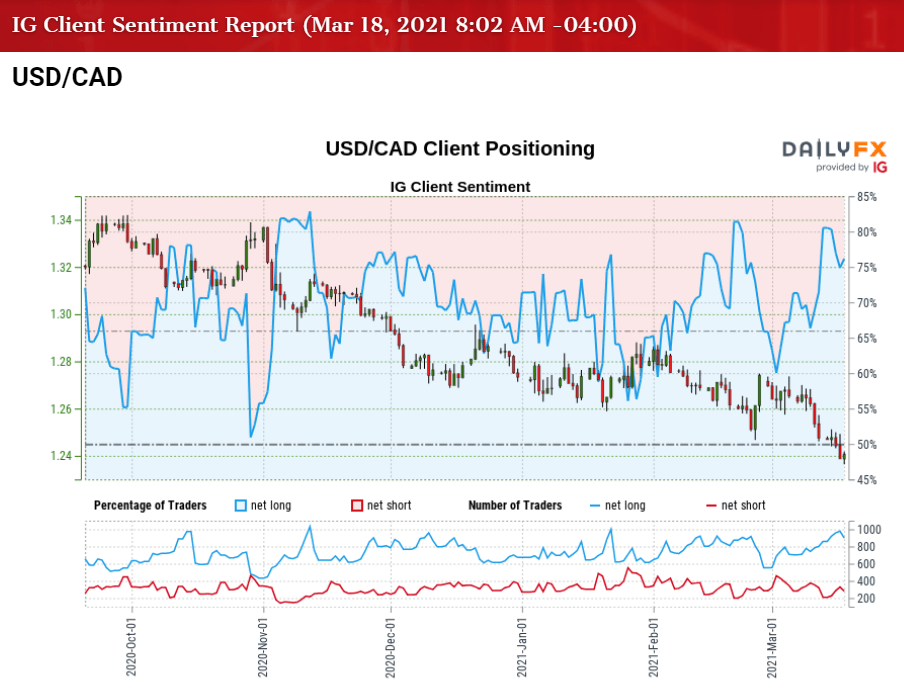
The IG Client Sentiment report shows 76.17% of traders are currently net-long USD/CAD, with the ratio of traders long to short standing at 3.20 to 1.
The number of traders net-long is 8.01% lower than yesterday and 10.71% higher from last week, while the number of traders net-short is 15.41% lower than yesterday and 23.22% lower from last week. The rise in net-long interest has fueled the crowding behavior in USD/CAD as 75.50% of traders were net-long last week, while the decline in net-short position could be a function of profit-taking behavior as the exchange rate trades to a fresh yearly low (1.2365) following the Fed rate decision.
With that said, swings in risk appetite may continue to sway USD/CAD as the US Dollar broadly reflects an inverse relationship with investor confidence, and the pullback from the 50-Day SMA (1.2666) may continue to generate fresh yearly lows in the exchange rate as it extends the series of lower highs and lows carried over from the previous week.

USD/CAD Rate Daily Chart
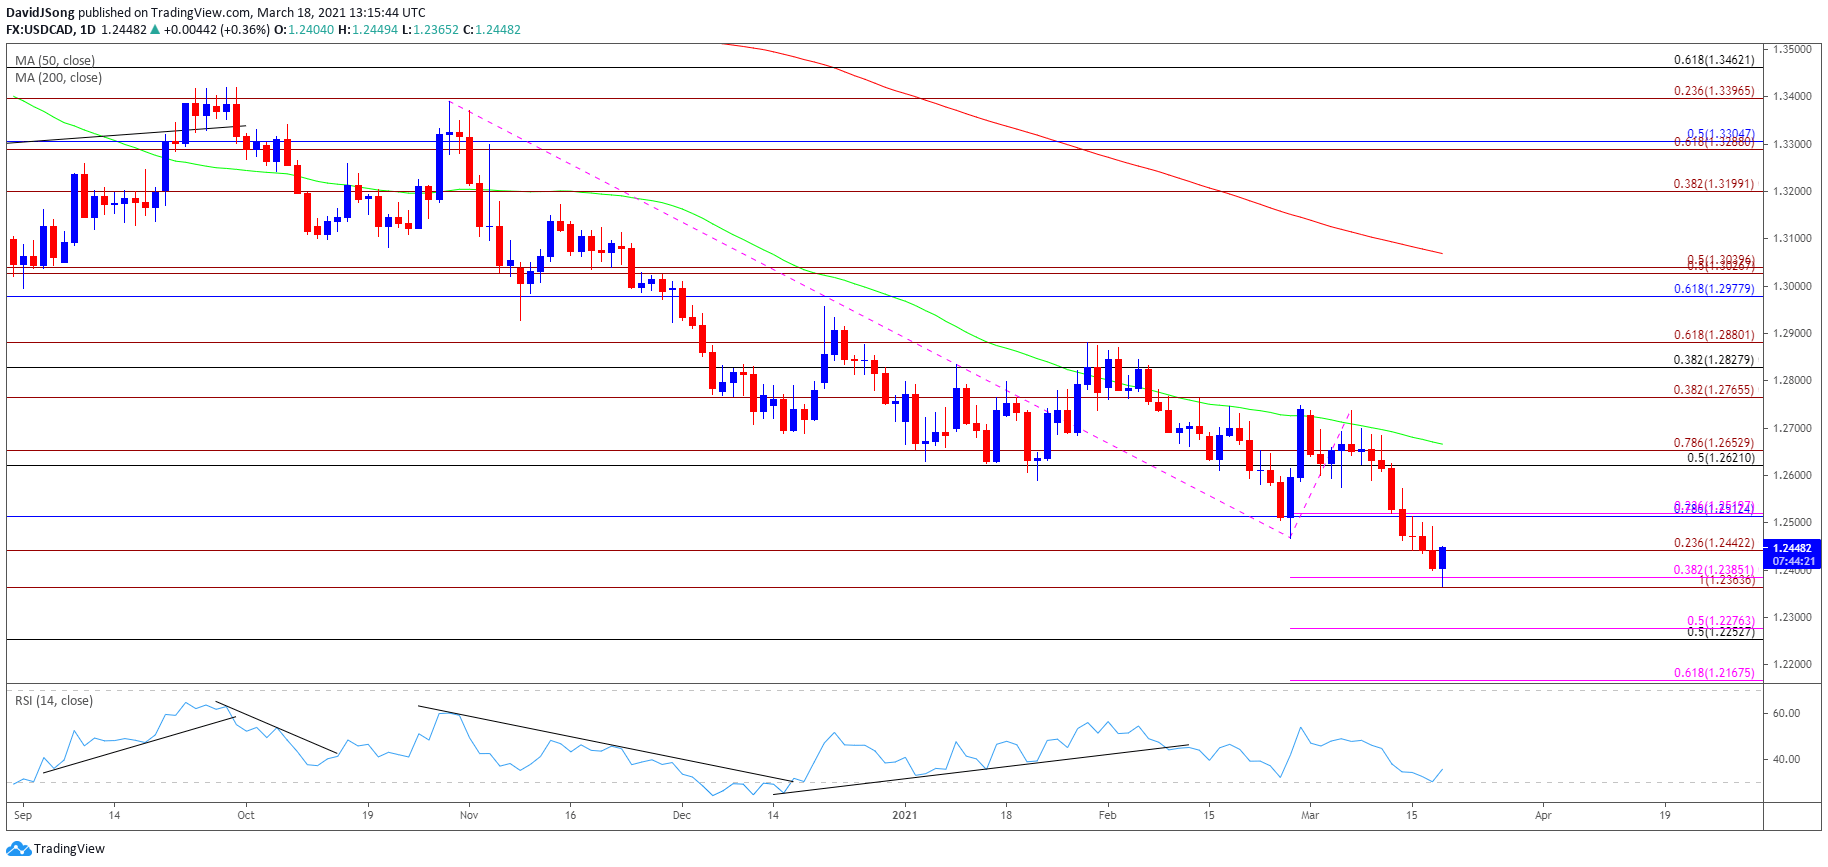
Source: Trading View
- Keep in mind, USD/CAD cleared the January 2020 low (1.2957) following the US election, with the exchange rate trading to fresh yearly lows in November and December as the Relative Strength Index (RSI) established a downward trend during the same period.
- USD/CAD started off 2021 by taking out last year’s low (1.2688) even though the RSI broke out of the bearish formation, with lack of momentum to hold above the 1.2770 (38.2% expansion) region pushing the exchange rate briefly below the Fibonacci overlap around 1.2620 (50% retracement) to 1.2650 (78.6% expansion).
- A break/close below the Fibonacci overlap around 1.2620 (50% retracement) to 1.2650 (78.6% expansion) materialized in February, which pushed USD/CAD to fresh yearly lows, with a similar scenario taking shape in March following the break/close below the 1.2510 (78.6% retracement) region.
- Need a break/close below the 1.2360 (100% expansion) to 1.2390 (38.2% expansion) zone to open up theFibonacci overlap around 1.2250 (50% retracement) to 1.2280 (50% expansion), which lines up with the January 2018 low (1.2247), with the next area of interest coming in around 1.2170 (61.8% expansion).
- Will keep a close eye on the RSI as it appears to be bouncing back ahead of oversold territory, but a break below 30 in the oscillator is likely to be accompanied by a further decline in USD/CAD like the behavior seen in 2020.

--- Written by David Song, Currency Strategist
Follow me on Twitter at @DavidJSong


