

Oil Price Talking Points
The price of oil trades to a fresh yearly high ($63.79) despite an unexpected rise in US crude inventories, with the technical outlook clouded with mixed signals as the Relative Strength Index (RSI) appears to be diverging with price.
Oil Price Approaches 2020 High Even as RSI Divergence Takes Shape
The price of oil appears to be on track to test the 2020 high ($65.65) ahead of the Organization of the Petroleum Exporting Countries (OPEC)Joint Ministerial Monitoring Committee (JMMC) meeting on March 3 as it extends the series of higher highs and lows from earlier this week.
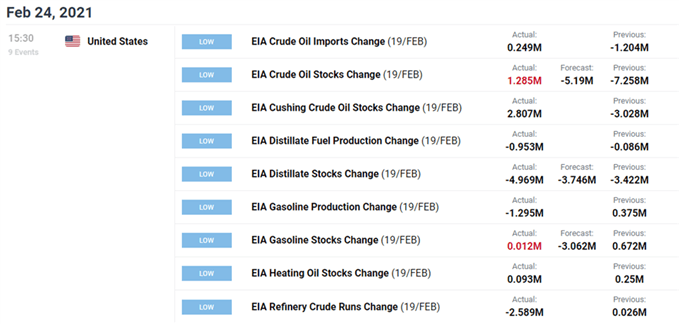
Fresh data prints coming out of the US have done little to curb the oil price rally even though US crude inventories increased for the first time in six weeks, with stockpiles rising 1.285M in the week ending February 19 versus forecasts for a 5.19M decline.
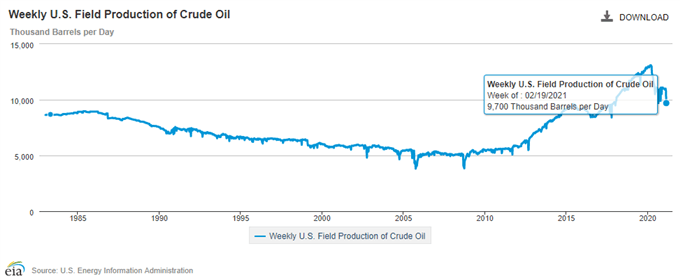
However, the updated from the Energy Information Administration (EIA) showed US crude production falling to the lowest level since 2017 as weekly field production tumbled to 9,700 from 10,800 in the week ending February 12. The ongoing weakness in US output may keep the price of oil afloat as Saudi Arabia stays on track to reduce supply by 1 million b/d until April, and OPEC and its allies may continue to regulate the energy market in 2021 as the latest Monthly Oil Market Report (MOMR) states that “for 2021, oil demand is now anticipated to increase by 5.8 mb/d, revised down by around 0.1 mb/d from last month’s projection, to average 96.1 mb/d.”
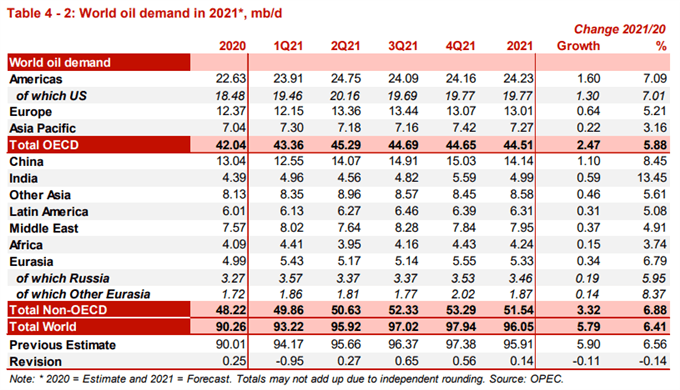
The February MOMR warns that “extended lockdowns and the re-introduction of partial lockdowns in a number of countries has resulted in downward revisions to 1H21 projections,” but goes onto say that “positive developments on the economic front, supported by massive stimulus programmes, are expected to encourage demand in various sectors in 2H21.”
In turn, OPEC and its allies may look to switch gears later this year as Secretary General Mohammad Barkindo pledges to “act in the interests of producers and consumers,” but the ongoing weakness in US output may push the price of oil towards the 2020 high ($65.65)as it still tracks the upward trending channel established in November.
However, the technical outlook is clouded with mixed signals as the Relative Strength Index (RSI) struggles to replicate the extreme reading registered earlier this month and appears to be diverging with price, with the oscillator briefly flashing a textbook sell signal earlier this week as it slipped below 70.
With that said, it remains to be seen if the RSI divergence will continue to take shape in March amid the lack of momentum to mark a fresh 2021 high, but the price of oil appears to be on track to test the 2020 high ($65.65) as it extends the series of higher highs and lows from earlier this week.
Oil Price Daily Chart
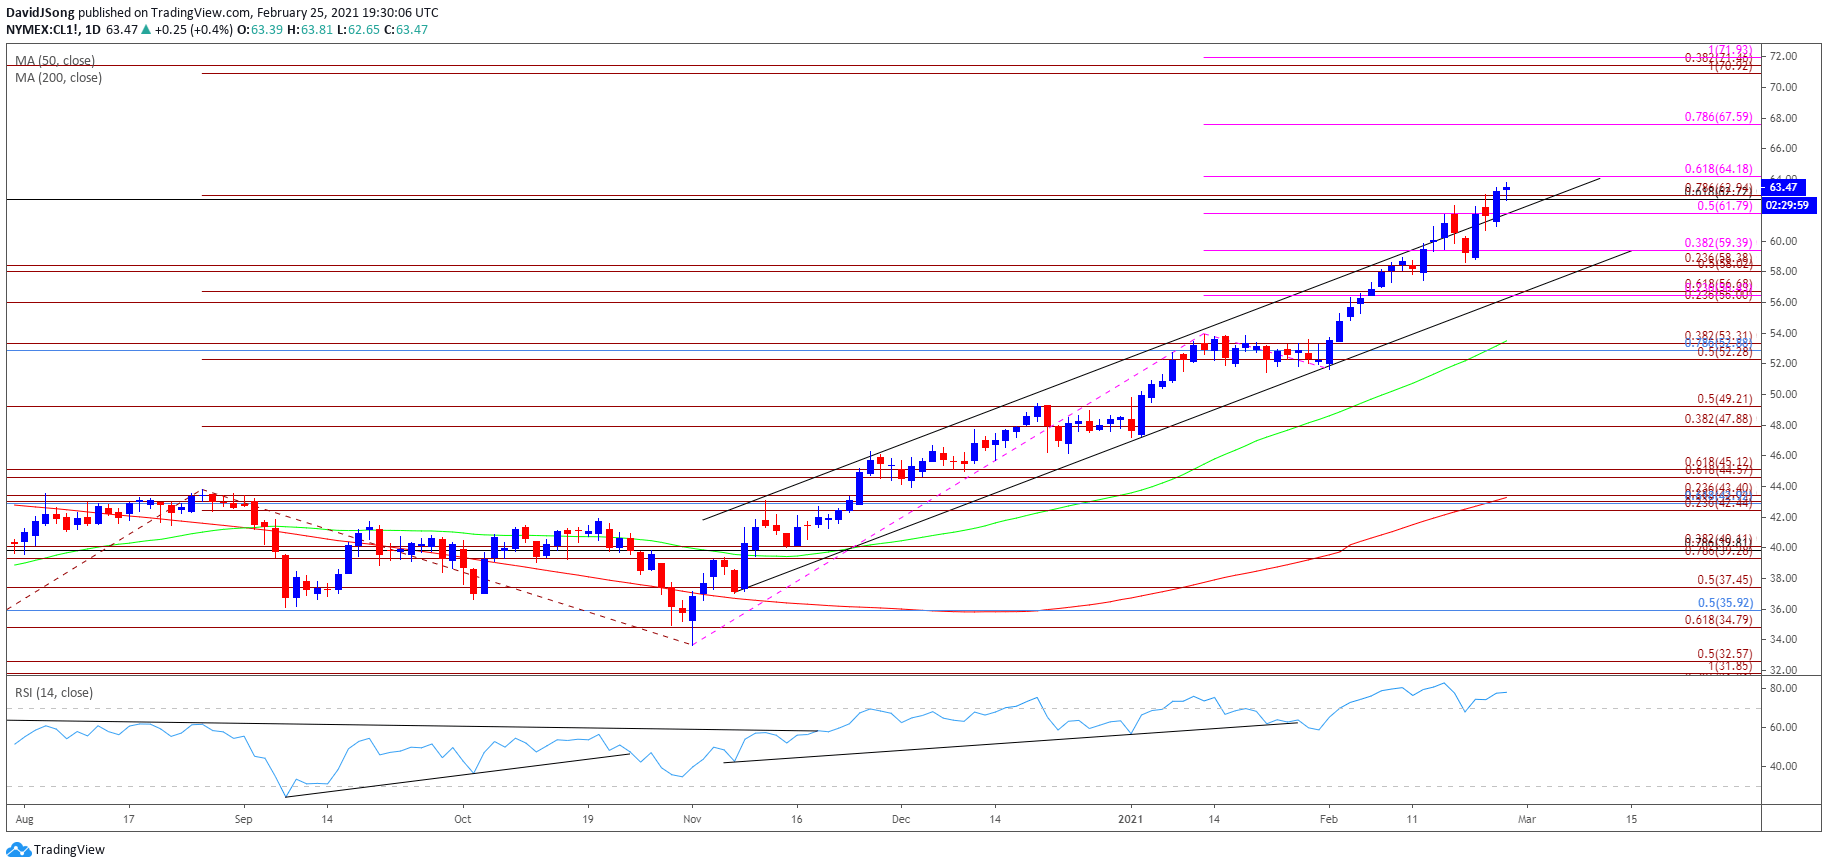
Source: Trading View
- Keep in mind, crude broke out of the range bound price action from the third quarter of 2020 following the failed attempt to close below the Fibonacci overlap around $34.80 (61.8% expansion) to $35.90 (50% retracement), and the price of oil may continue to retrace the decline from the 2020 high ($65.65) as both the 50-Day SMA ($53.50) and 200-Day SMA( $43.29) track a positive slope.
- More recently, crude has broken out of the range bound price action carried over from the end of January to extend the upward trend established in November, but the Relative Strength Index (RSI) has failed to keep up as a break of trendline support emerged ahead of February.
- Nevertheless, developments in the RSI offered a constructive outlook as the oscillator held above 70 since the start of February, but the indicator now appears to be diverging with price as it struggles to replicate the extreme reading registered earlier this month even though the price of oil trades to a fresh yearly high ($63.79).
- The break/close above the Fibonacci overlap around $62.70 (61.8% retracement) to $62.90 (78.6% expansion) brings the $64.20 (61.8% expansion) region on the radar followed by the 2020 high ($65.65), with the next area of interest coming in around $67.60 (78.6% expansion).

--- Written by David Song, Currency Strategist
Follow me on Twitter at @DavidJSong