


Oil Price Talking Points
The price of oil attempts to retrace the decline from the monthly high ($62.29) as it continues to track the ascending channel established in November, but a textbook sell signal has emerged in the Relative Strength Index (RSI) as the oscillator falls back from overbought territory and slips below 70.
Oil Price Forecast: Crude Technical Outlook Mired by RSI Sell Signal
The recent weakness in the price of oil appears to be a sign of exhaustion rather than a change in the broader trend as it pulls back from channel resistance, and crude prices may consolidate over the remainder of the month as the bullish momentum abates, with the RSI registering a reading below 70 for the first time since the start of February.
It remains to be seen if fresh data prints coming out of the US will prop up oil prices as crude inventories contract for the fifth consecutive week, with stockpiles narrowing 7.258M in the week ending February 12, while oil production remains at its lowest level since 2018.
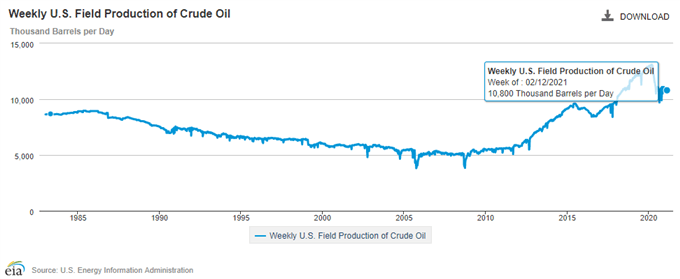
The update from the Energy Information Administration (EIA) showed crude production slipping to 10,800K from 11,000K in the week ending February 5, and signs of stronger consumption paired with ongoing weakness in crude output may keep oil prices afloat even as the Organization of the Petroleum Exporting Countries (OPEC) Secretary General, Mohammad Barkindo, pledges to “act in the interests of producers and consumers.”
Barkindo emphasized that OPEC and its allies “seek to contribute to greater stability, more predictability and enhanced transparency” while speaking at the 11th IEA-IEF-OPEC Symposium on Energy Outlooks, and key market themes may keep the price of oil afloat ahead of the next OPEC Joint Ministerial Monitoring Committee (JMMC) meeting on March 3 as Saudi Arabia remains on track to reduce supply by 1 million b/d until April.
With that said, the price of oil may continue to retrace the decline 2020 high ($65.65) as it still tracks the upward trending channel established in November, but crude prices may face a larger correction over the remainder of the month as the Relative Strength Index (RSI) falls back from overbought territory to indicate a textbook sell signal.
Oil Price Daily Chart
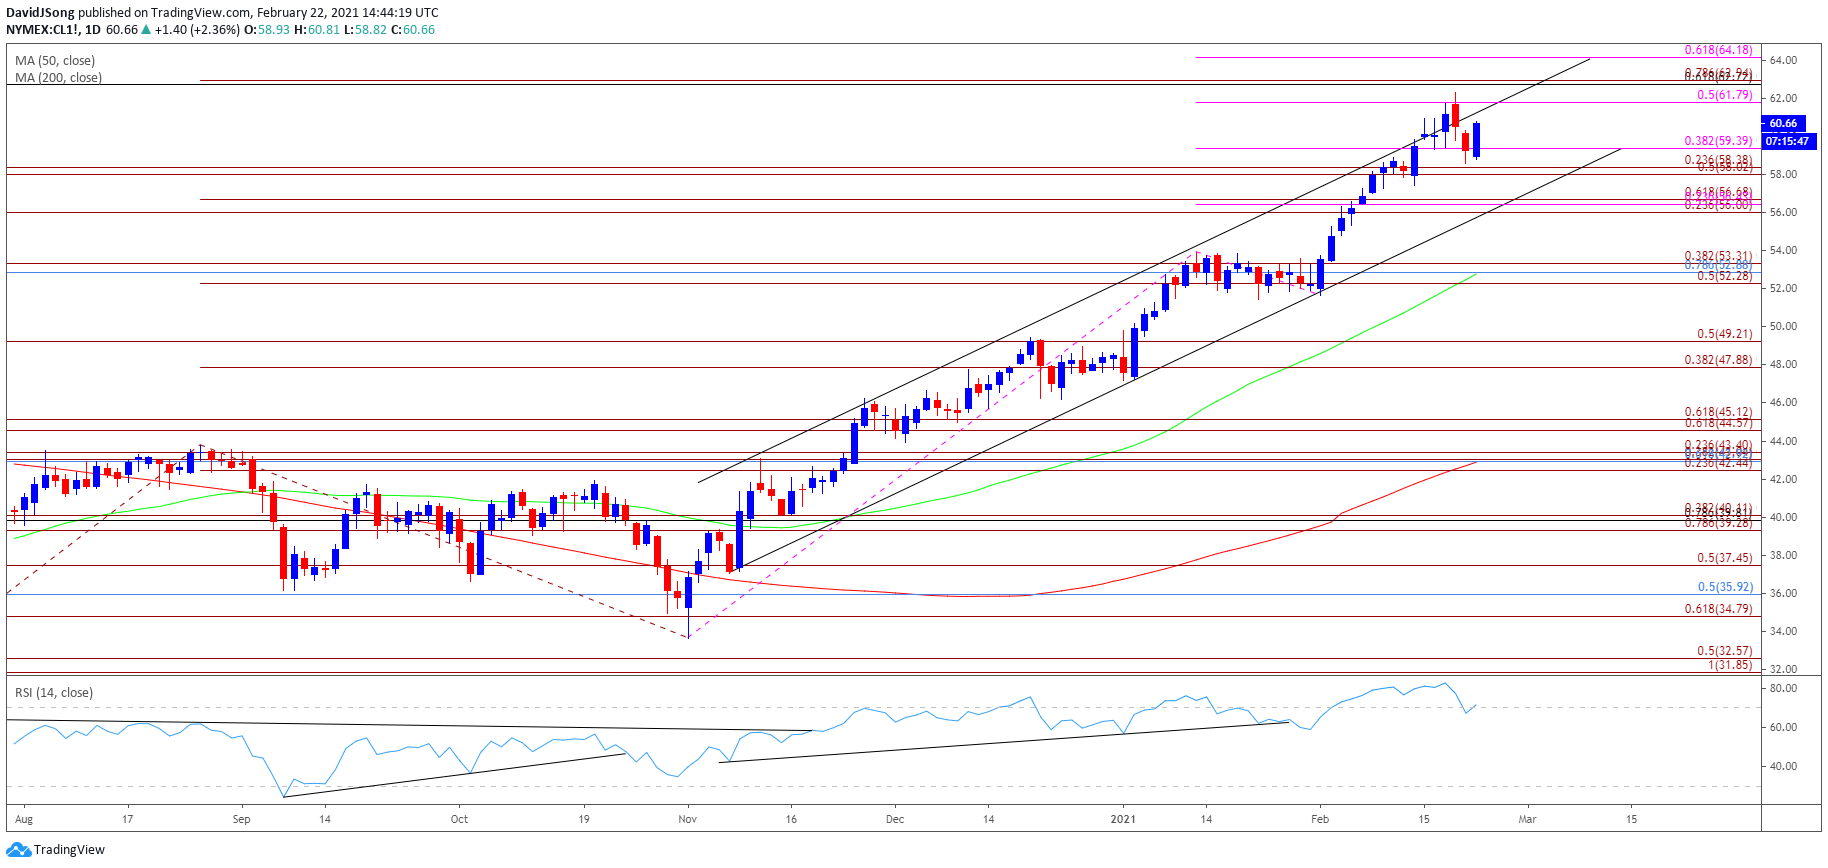
Source: Trading View
- Keep in mind, crude broke out of the range bound price action from the third quarter of 2020 following the failed attempt to close below the Fibonacci overlap around $34.80 (61.8% expansion) to $35.90 (50% retracement), and the price of oil may continue to retrace the decline from the 2020 high ($65.65) as both the 50-Day SMA ($52.78) and 200-Day SMA( $42.89) track a positive slope.
- More recently, crude has broken out of the range bound price action carried over from the end of January to extend the upward trend established in November, but the Relative Strength Index (RSI) has failed to keep up as a break of trendline support emerged ahead of February.
- Nevertheless, developments in the RSI offered a constructive outlook as the oscillator held above 70 since the start of February, but a textbook sell signal has emerged going into the end of the month as the oscillator falls back from overbought territory.
- The price of oil trades back within the confines of the ascending channel after failing to break/close above the Fibonacci overlap around $62.70 (61.8% retracement) to $62.90 (78.6% expansion), and crude may continue to consolidate over the remainder of the month as the $58.00 (50% expansion) to $58.40 (23.6% expansion) region appears to be offering near-term support.
- However, lack of momentum to hold above the $58.00 (50% expansion) to $58.40 (23.6% expansion) region may push the price of oil towards channel support, which lines up with the overlap around $56.00 (23.6% expansion) to $56.70 (61.8% expansion).

--- Written by David Song, Currency Strategist
Follow me on Twitter at @DavidJSong


