


Oil Price Talking Points
The price of oil preserves the range bound price action from earlier this week following an unexpected contraction in US crude inventories, and key market themes may keep energy prices afloat as oil production remains subdued.
Oil Price Reverses Ahead of Weekly Low as US Crude Inventories Fall
The price of oil bounces back ahead of the weekly low ($51.82) as fresh data prints coming out of the US instill an improved outlook for demand, with crude inventories falling 9.91M in the week ending January 22 versus forecasts for a 0.43M rise.
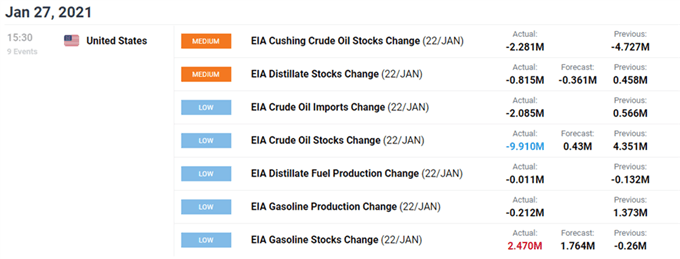
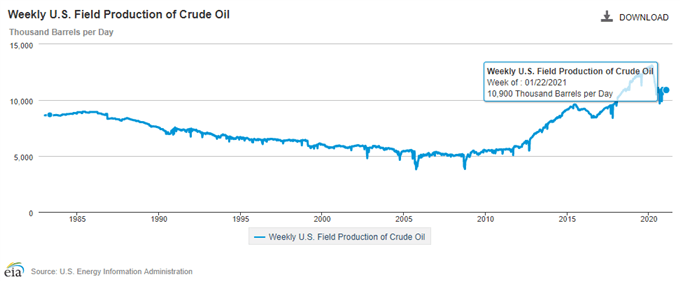
At the same time, the figures coming out of the Energy Information Administration (EIA) showed crude production narrowing to 10,900K after holding at 11,000K for five consecutive weeks, and the pullback from the monthly high ($53.93) may turn out to be an exhaustion in the bullish price action rather than a change in trend as the Organization of the Petroleum Exporting Countries (OPEC) Secretary General, Mohammad Barkindo, insists that the group “will continue to take a month-by-month approach to assessing market conditions” while speaking at the S&P Global Platts AmericasPetroleum and Energy Conference.
Barkindo goes onto say that OPEC and its allies “stand ready to take any necessary actions” amid the renewed COVID-19 restrictions, and it seems as though the group will continue to regulate the energy market in 2021 as Saudi Arabia remains on track to reduce supply by 1 million b/d until April 2021.
In turn, key market themes may keep the energy prices afloat throughout the first quarter as US crude out remains at its lowest level since 2018, and the pullback from the monthly high ($53.95) may turn out to be an exhaustion in the bullish price action rather than a change in trend as the contraction in crude inventories instill an improved outlook for demand.
With that said, the technical outlook remains constructive as crude continues to trade above pre-pandemic levels, and its seems as though the price of oil is attempting to reversed course ahead of the monthly low ($51.82) as the Relative Strength Index (RSI) still tracks the upward trend carried over from 2020.
Oil Price Daily Chart
Source: Trading View
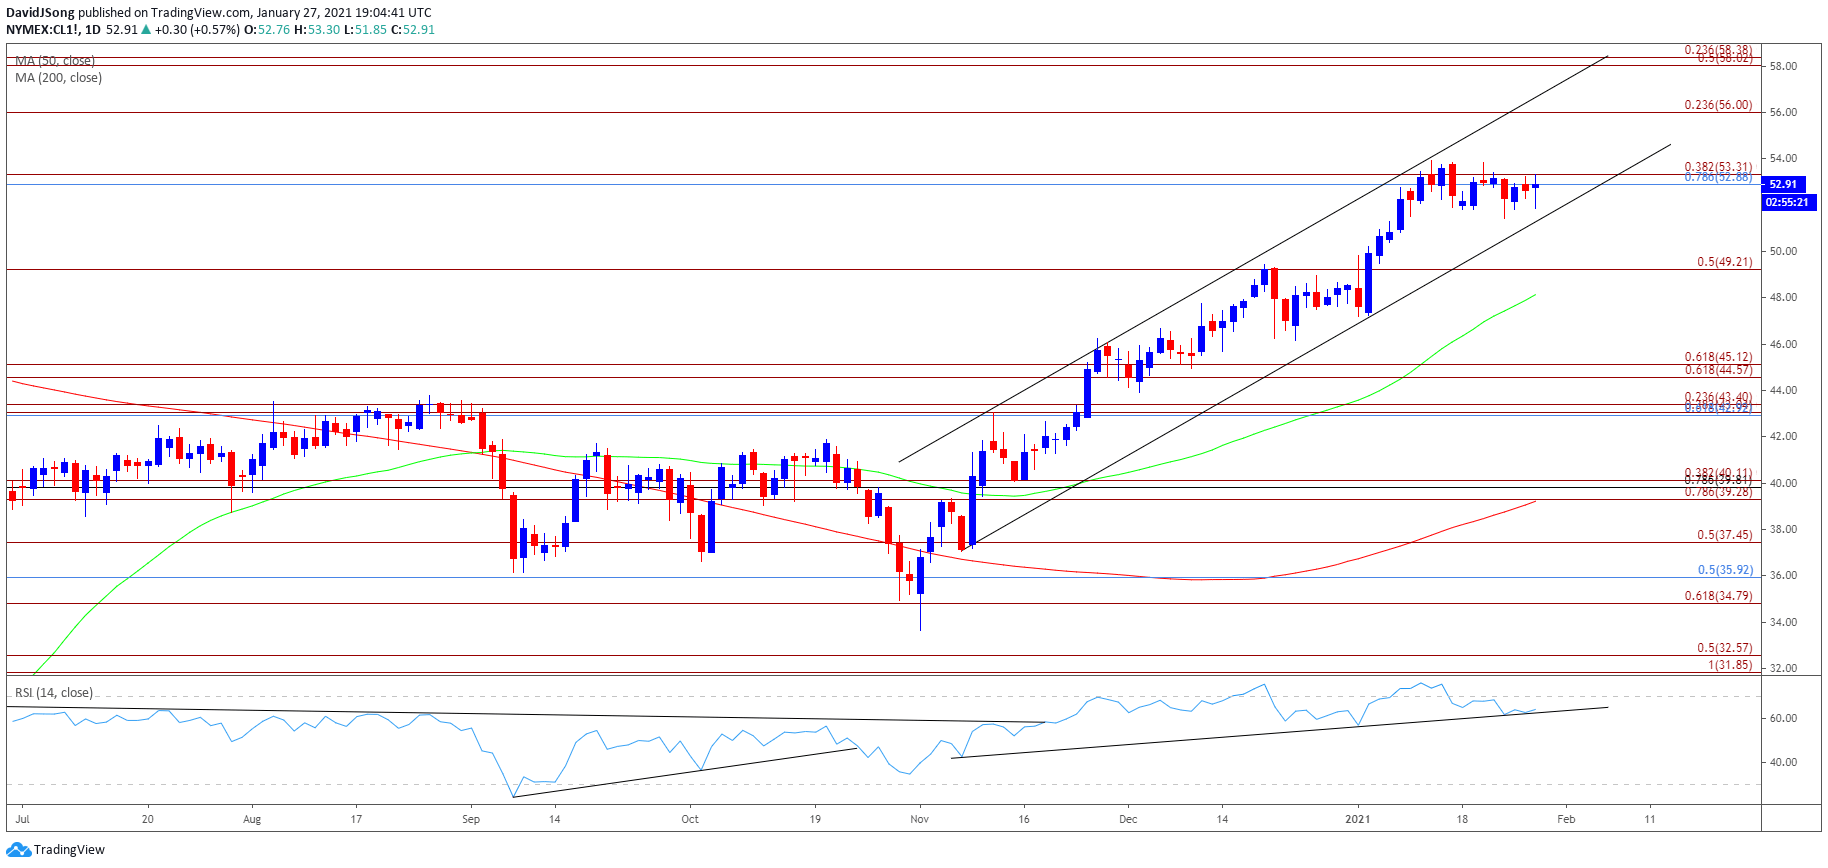
- Keep in mind, crude broke out of the range bound price action from the third quarter of 2020 following the failed attempt to close below the Fibonacci overlap around $34.80 (61.8% expansion) to $35.90 (50% retracement), and the price of oil may continue to retrace the decline from the start of 2020 as both the 50-Day SMA ($48.14) and 200-Day SMA( $39.22) establish a track a positive slope.
- Crude appears to be stuck in a narrow range following the string of failed attempts to test the February 2020 high ($54.66), but the RSI offers a constructive outlook as it continues to track the upward trend from 2020.
- Will keep a close eye on the RSI as it appears to be responding to trendline support, with a move above 70 likely to be accompanied by higher oil prices like the behavior seen earlier this month.
- Still need a close above the Fibonacci overlap around $52.90 (78.6% retracement) to $53.30 (38.2% expansion) to bring the February 2020 high ($54.66) back on the radar as the price of oil continues to track the range bound price action from earlier this week.
- Next area of interest coming in around the $56.00 (23.6% expansion) handle followed by the $58.00 (50% expansion) to $58.40 (23.6% expansion) region.

--- Written by David Song, Currency Strategist
Follow me on Twitter at @DavidJSong


