


EUR/USD Rate Talking Points
EUR/USD carves a series of lower highs and lows following the failed attempt to test the April 2018 high (1.2414), and the pullback from the monthly high (1.2350) may gather pace as long as the Relative Strength Index (RSI) tracks the downward trend established in December.
EUR/USD Susceptible to Larger Pullback Ahead of Account of ECB Meeting
EUR/USD remains under pressure after snapping the opening range for January, and the account of the European Central Bank’s (ECB) December meeting may do little to prop up the Euro as President Christine Lagarde and Co. plan to carry out the pandemic emergency purchase programme (PEPP) “until the Governing Council judges that the coronavirus crisis phase is over.”

It remains to be seen if the ECB will take additional steps to support the Euro Area in 2021 as Governing Council member Isabel Schnabel warns of “a pronounced weakness in demand,” and it seems as though the central bank will continue to strike a dovish forward guidance at its next meeting on January 21 as “there are no indications that we need to be concerned about inflation being too high.”
Until then, swings in investor confidence may sway EUR/USD as the US Dollar still reflects an inverse reflation with risk appetite, and tilt in retail sentiment also looks poised to persist as traders have been net-short the pair since November.
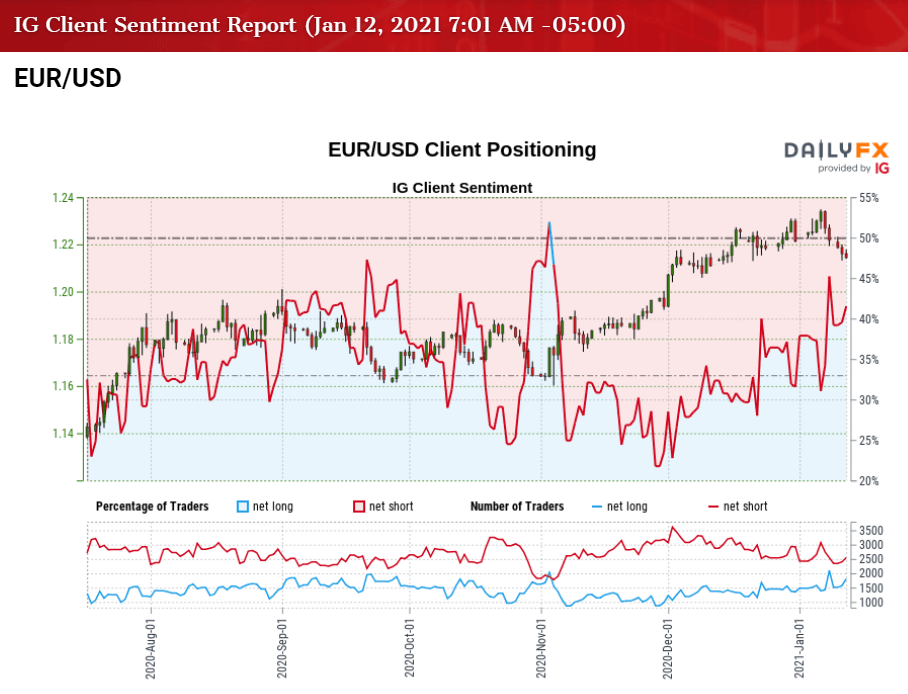
The IG Client Sentiment report shows 45.12% of traders are net-long with the ratio of traders short to long at 1.22 to 1. The number of traders net-long is 13.31% higher than yesterday and 24.27% higher from last week, while the number of traders net-short is 1.24% lower than yesterday and 10.00% lower from last week.
The decline in net-short position comes as EUR/USD extends the decline from the monthly high (1.2350), while the rise in net-long interest has helped to alleviate the crowding behavior as only 32.05% of traders were net-long the pair during the previous week.
With that said, the correction from the January high (1.2350)may end up being an exhaustion in the EUR/USD rally rather than a change in trend as key market themes remain in place, but the exchange rate remains susceptible to a larger pullback as long as the Relative Strength Index (RSI) tracks the downward trend established in December.

EUR/USD Rate Daily Chart
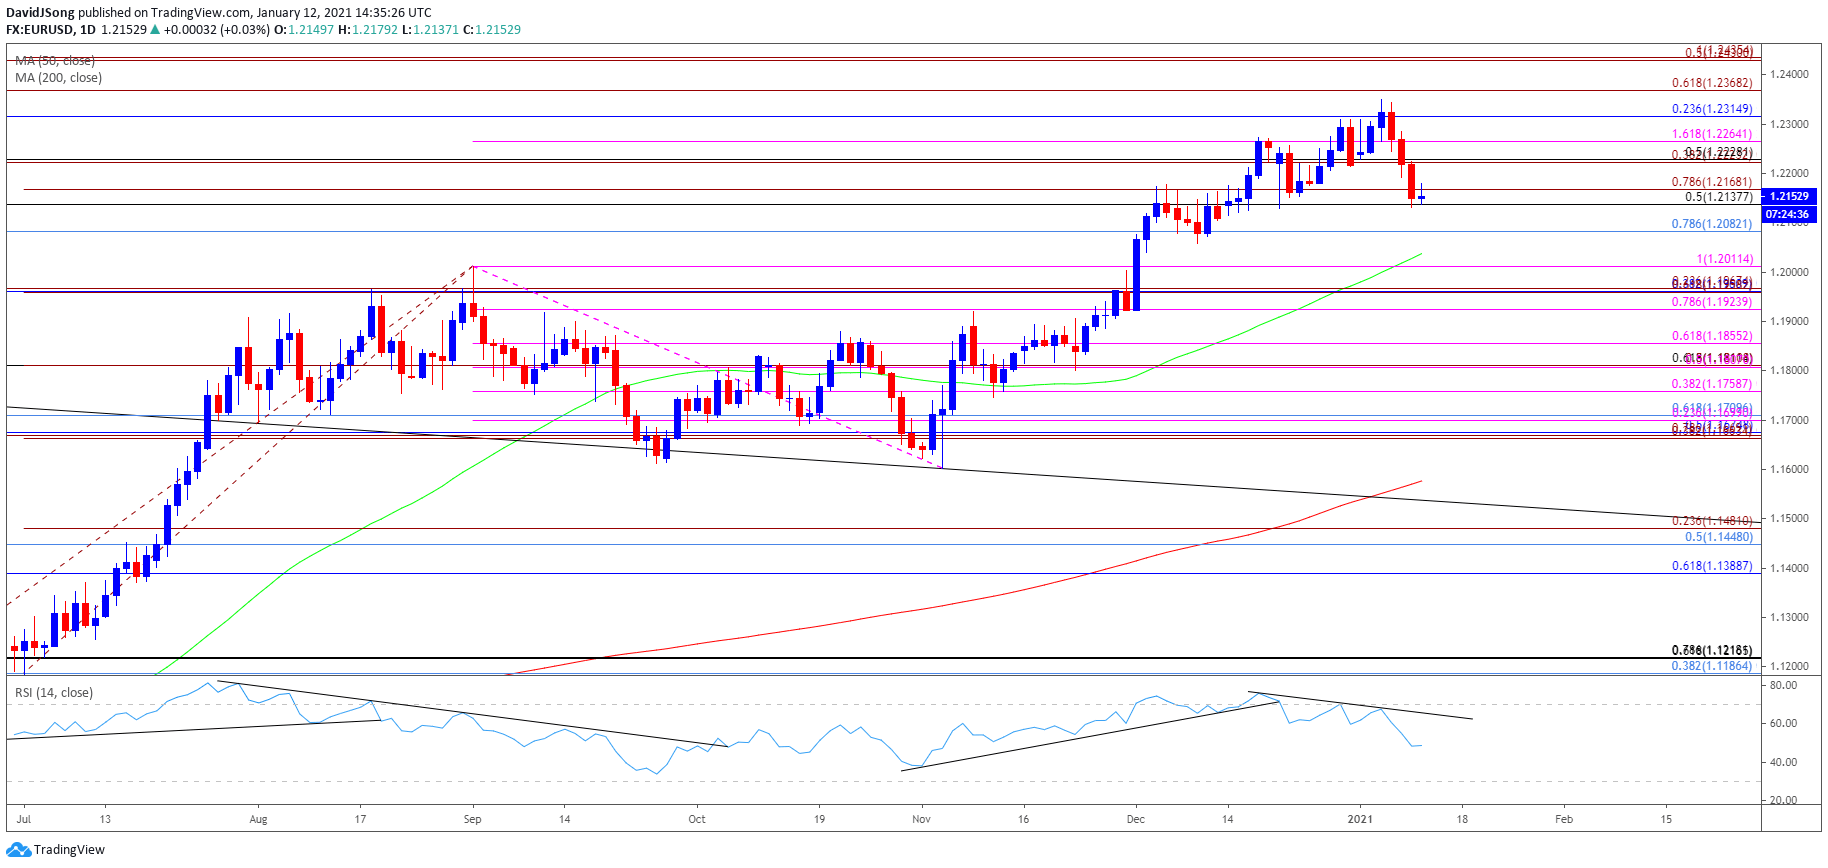
Source: Trading View
- Keep in mind, the EUR/USDcorrection from the September high (1.2011) proved to be an exhaustion in the bullish price action rather than a change in trend following the string of failed attempts to close below the 1.1600 (61.8% expansion) to 1.1640 (23.6% expansion) region, with the Relative Strength Index (RSI) highlighting a similar dynamic as it broke out of the downward trend carried over from the end of July to recover from its lowest readings since March.
- The break/close above the 1.1960 (38.2% retracement) to 1.1970 (23.6% expansion) region pushed EUR/USD to a fresh yearly highs throughout December, with the exchange rate taking out the 2020 high (1.2310) during the first week of January.
- However, EUR/USD has snapped the monthly opening range following the failed attempt to test the April 2018 high (1.2414), with the exchange rate susceptible to a larger pullback as long as the RSI tracks the downward trend established in December.
- Lack of momentum to hold above the Fibonacci overlap around 1.2140 (50% retracement) to 1.2370 (61.8% expansion) region may bring the 1.2080 (78.6% retracement) region back on the radar, with the next area of interest coming in around 1.2010 (100% expansion).

--- Written by David Song, Currency Strategist
Follow me on Twitter at @DavidJSong


