


Canadian Dollar Talking Points
USD/CAD trades to a fresh monthly high (1.3321) as the US Dollar appreciates against all of its major counterparts, but fresh remarks from Federal Reserve officials may produce headwinds for the Greenback as the central bank continues to endorse a dovish forward guidance for monetary policy.
USD/CAD Rate Tests Former-Support Zone for Resistance
USD/CAD has come up against the former-support zone around the March/June low (1.3315) as the recent decline in global equity prices coincides with the advance in the US Dollar, and a further shift in risk sentiment may fuel a larger correction in the exchange rate as it trades above the 50-Day SMA (1.3264) for the first time since May.
It remains to be seen if the advance from the monthly low (1.2994) will prove to be a change in market behavior or an exhaustion in the bearish trend as USD/CAD appears to be testing the former-support zone for resistance, and the upcoming testimony with Fed Chairman Jerome Powell may shape the near-term outlook as the central bank head along with Treasury Secretary Steven Mnuchin are scheduled to testify on the Coronavirus Aid, Relief, and Economic Security (CARES) Act.
Fresh remarks from New York Fed President John Williams, a permanent voting-member on the Federal Open Market Committee (FOMC), suggests the central bank is in no rush to alter the path for monetary policy as the official insists that the Fed is “not shy about doing whatever it takes to get this economy through this really difficult situation.”
Williams goes onto say that “what we really need is a very strong partnership, where Congress and government at the federal, state and local levels are doing their part,” and it seems as though the FOMC will continue to utilize its emergency tools to support the US economy as the central bank vows to “increase its holdings of Treasury securities and agency mortgage-backed securities at least at the current pace.”
In turn, current market trends may persist as the update to the Summary of Economic Projections (SEP) show the longer run interest rate forecast unchanged from the June meeting, and the FOMC may stick to the same script at the next interest rate decision on November 5 as the committee remains “committed to using our full range of tools to support the economy in this challenging time.”
At the same time, the crowding behavior in USD/CAD may also carry into the end of the month as retail traders have been net-long the pair since mid-May.
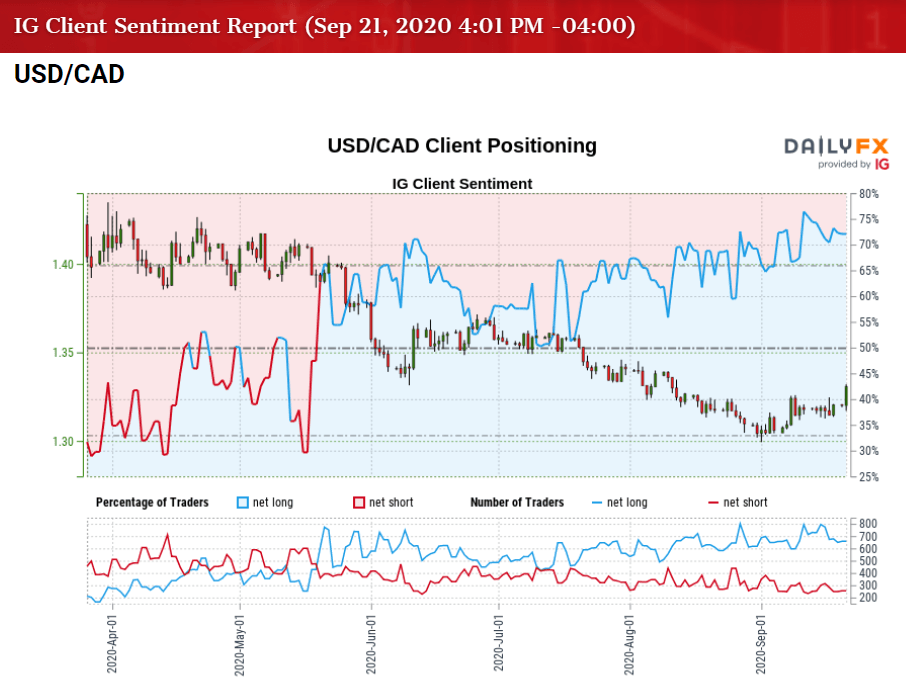
The IG Client Sentiment report shows 68.59% of traders are still net-long USD/CAD, with the ratio of traders long to short at 2.18 to 1. The number of traders net-long is 8.45% lower than yesterday and 23.07% lower from last week, while the number of traders net-short is 8.59% higher than yesterday and 9.45% lower from last week.
The decline in net-long position could be indicative of profit-taking behavior as USD/CAD trades to a fresh monthly high (1.33210), with the drop in net-short interest a result of stop-loss orders getting triggered, but the tilt in retail sentiment remains as 71.76% of traders were net-long the pair last week.
With that said, the crowding behavior may continue to coincide with the bearish trend in USD/CAD, and the advance from the monthly low (1.2994) may end up being an exhaustion of the bearish price action rather than a change in market behavior as the exchange rate appears to be testing the former-support zone around the March/June low (1.3315) for resistance.

Sign up and join DailyFX Currency Strategist David Song LIVE for an opportunity to discuss potential trade setups.
USD/CAD Rate Daily Chart
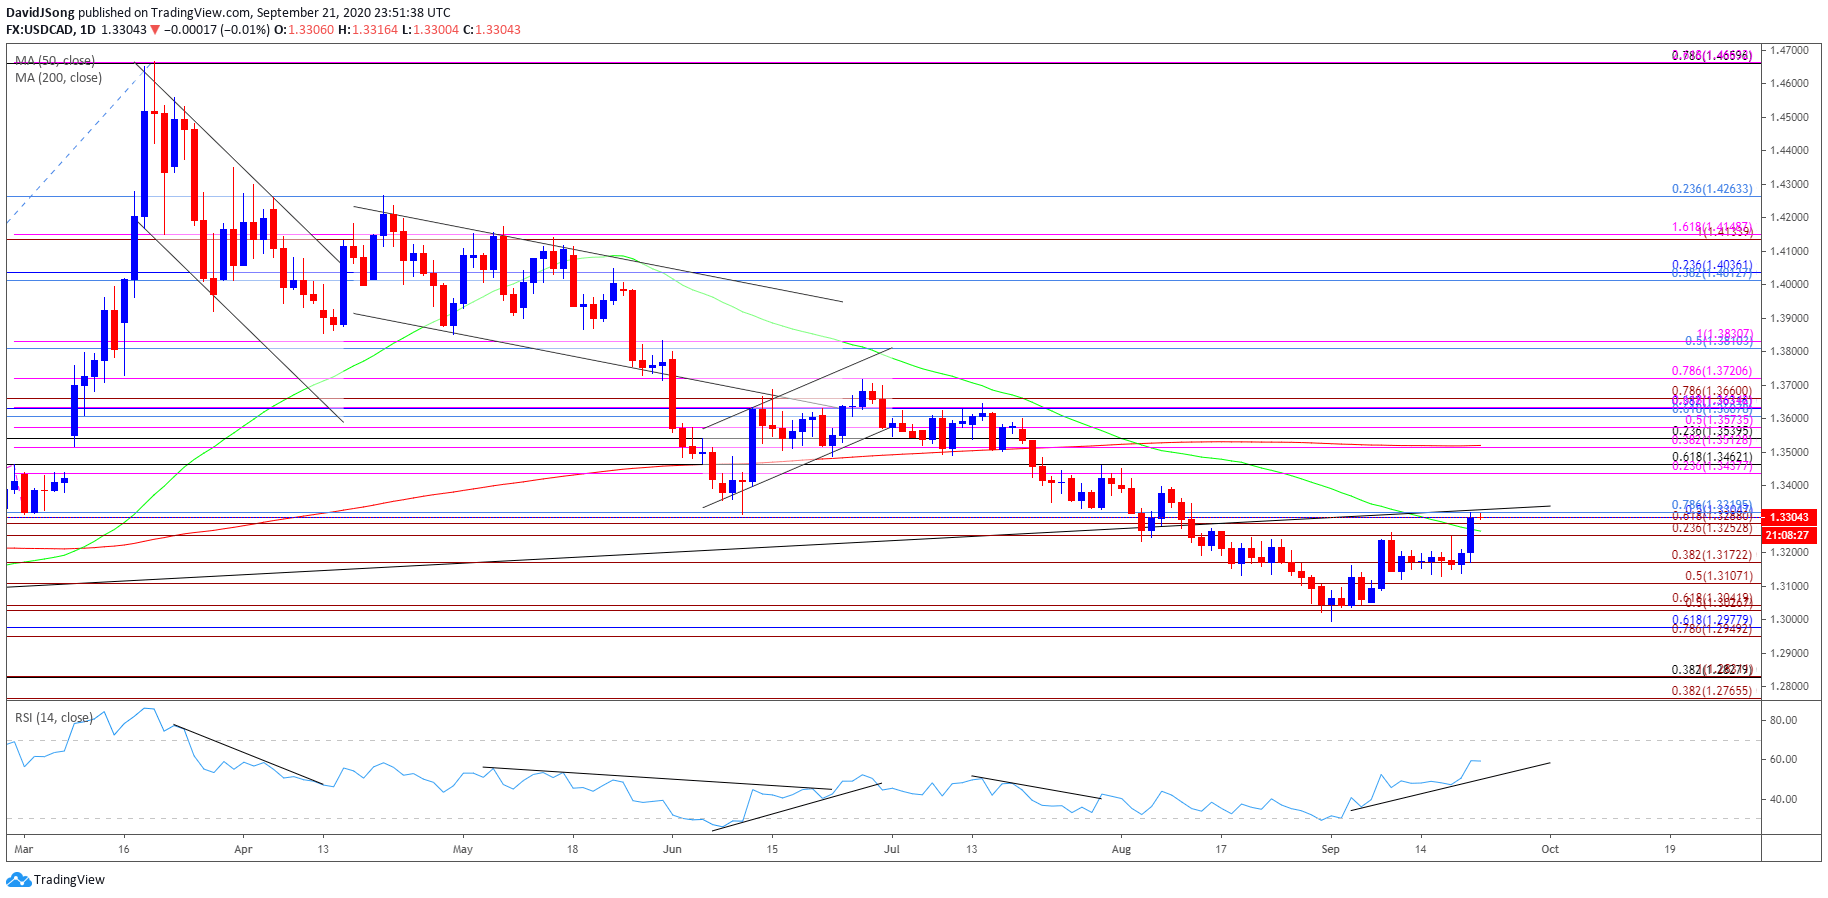
Source: Trading View
- Keep in mind, the USD/CAD correction from the 2020 high (1.4667) managed to fill the price gap from March, with the decline in the exchange rate pushing the Relative Strength Index (RSI) into oversold territory for the first time since the start of the year.
- Nevertheless, USD/CAD reversed from the March low (1.3315) in June, with both price and the RSI carving an upward trend during the month, but the bullish formations have been largely negated as the exchange rate snapped the range bound price action during the first half of July.
- USD/CAD managed to track the June range throughout July as the RSI broke out of a downward trend, but the failed attempt to push back above the 1.3440 (23.6% expansion) to 1.3460 (61.8% retracement) region has spurred a break of the March/June low (1.3315) even though the momentum indicator failed to push into oversold territory.
- The decline from the August high (1.3451) briefly pushed the RSI below 30, but lacked the momentum to produce a test of the January low (1.2957) as the indicator failed to reflect the extreme reading in June, with the oscillator quickly recovering from oversold territory.
- The advance from the monthly low (1.2994) has pushed USD/CAD above 50-Day SMA (1.3264) for the first time since May, with a closing price above the Fibonacci overlap around 1.3290 (61.8% expansion) to 1.3320 (78.6% retracement) opening up the 1.3440 (23.6% expansion) to 1.3460 (61.8% retracement) region as the Relative Strength Index (RSI) establishes an upward trend in September.
- However, the former-support zone around March/June low (1.3315) may offer resistance amid the lack of momentum to close above the Fibonacci overlap around 1.3290 (61.8% expansion) to 1.3320 (78.6% retracement), with failure to hold above the 1.3250 (23.6% expansion) region bringing the 1.3170 (38.2% expansion) area back on the radar.
- Next area of interest comes in around 1.3110 (50% expansion) followed by the overlap around 1.3030 (50% expansion) to 1.3040 (61.8% expansion).

--- Written by David Song, Currency Strategist
Follow me on Twitter at @DavidJSong


