


EUR/USD Rate Talking Points
EUR/USD is on the cusp of breaking out of last month’s range as it comes up against the August high (1.1966), and the Relative Strength Index (RSI) may offer a bullish signal as the indicator approaches overbought territory.
Euro Rate Outlook: RSI Indicator to Validate EUR/USD Breakout
EUR/USD carves a series of higher highs and lows following the kneejerk reaction to the Federal Reserve Economic Symposium, and the RSI may indicate a further appreciation in the exchange rate as it appears to be breaking out of the downward trend established in August and pushes towards overbought territory.
It remains to be seen if the RSI will show an extreme reading like the behavior seen in July as the Federal Open Market Committee (FOMC) appears to be on track to retain the current policy at the next interest rate decision on September 16, and current market trends may persist throughout the remainder of the year as the central bank plans to “achieve inflation that averages 2 percent over time.”
The remarks from Chairman Jerome Powell suggests the FOMC is in no rush to scale back its emergency measures even though the committee discusses an outcome-based approach versus a calendar-based forward guidance for monetary policy, and it seems as though the Fed will utilize its non-standard tools well beyond the US election as the “new Statement on Longer-Run Goals and Monetary Policy Strategy conveys our continued strong commitment to achieving our goals, given the difficult challenges presented by the proximity of interest rates to the effective lower bound.”
Meanwhile, European Central Bank (ECB) board member Isabel Schnabel insists that “there is no reason to adjust the monetary policy stance” as the Euro Area appears to be operating near the baseline scenario, with the monetary union expected to show “a strong rebound in the third quarter.”
In turn, President Christine Lagarde and Co. may continue to emphasizes that the EUR 1.350 trillion envelope for the pandemic emergency purchase programme (PEPP) “should be considered a ceiling rather than a target,” and the Euro may continue to outperform its US counterpart ahead of the next ECB meeting on September 10 as the central bank tames speculation for additional monetary support.
Nevertheless, the crowding behavior in the US Dollar looks poised to persist in September as retail traders have been net-short EUR/USD since mid-May, with the IG Client Sentiment report showing only 31.64% of traders net-long the pair as the ratio of traders short to long stands at 2.16 to 1.
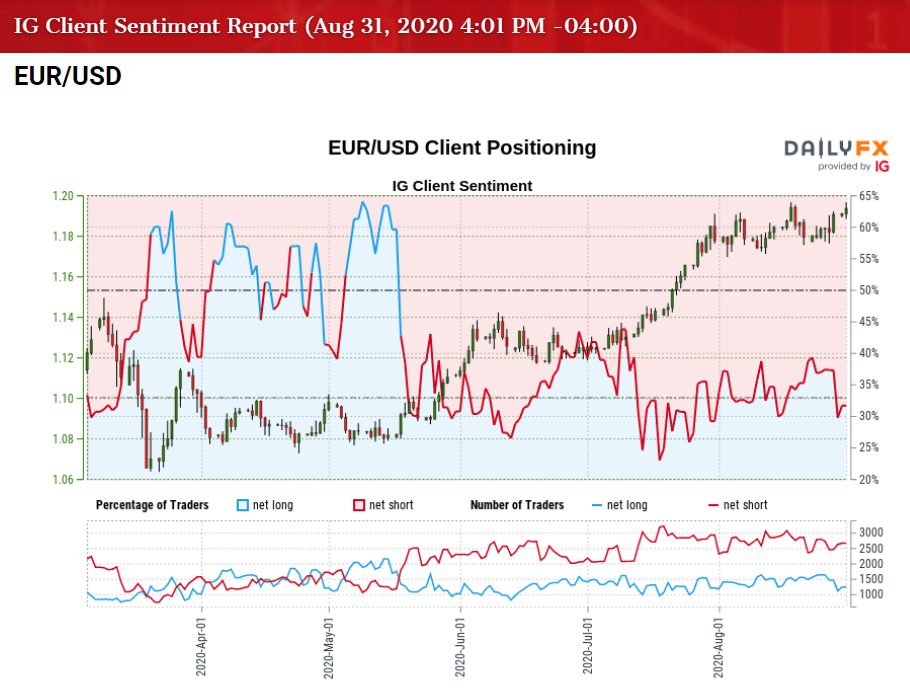
The number of traders net-long is 22.49% higher than yesterday and 12.40% lower from last week, while the number of traders net-short is 11.92% higher than yesterday and 1.10% higher from last week.
The decline in net-long position could be indicative of profit-taking behavior as EUR/USD comes up against the August high (1.1966), while the rise in net-short interest suggests the tilt in retail sentiment will persist over the coming days even though the exchange rate appears to be on the cusp of breaking out of last month’s range.
With that said, current market conditions may keep EUR/USD afloat as the exchange rate carves series of higher highs and lows following the Fed symposium, and the Relative Strength Index (RSI) may show the bullish price action gathering pace as the indicator threatens the downward trend established in August and pushes towards overbought territory.

Sign up and join DailyFX Currency Strategist David Song LIVE for an opportunity to discuss key themes and potential trade setups surrounding foreign exchange markets.
EUR/USD Rate Daily Chart
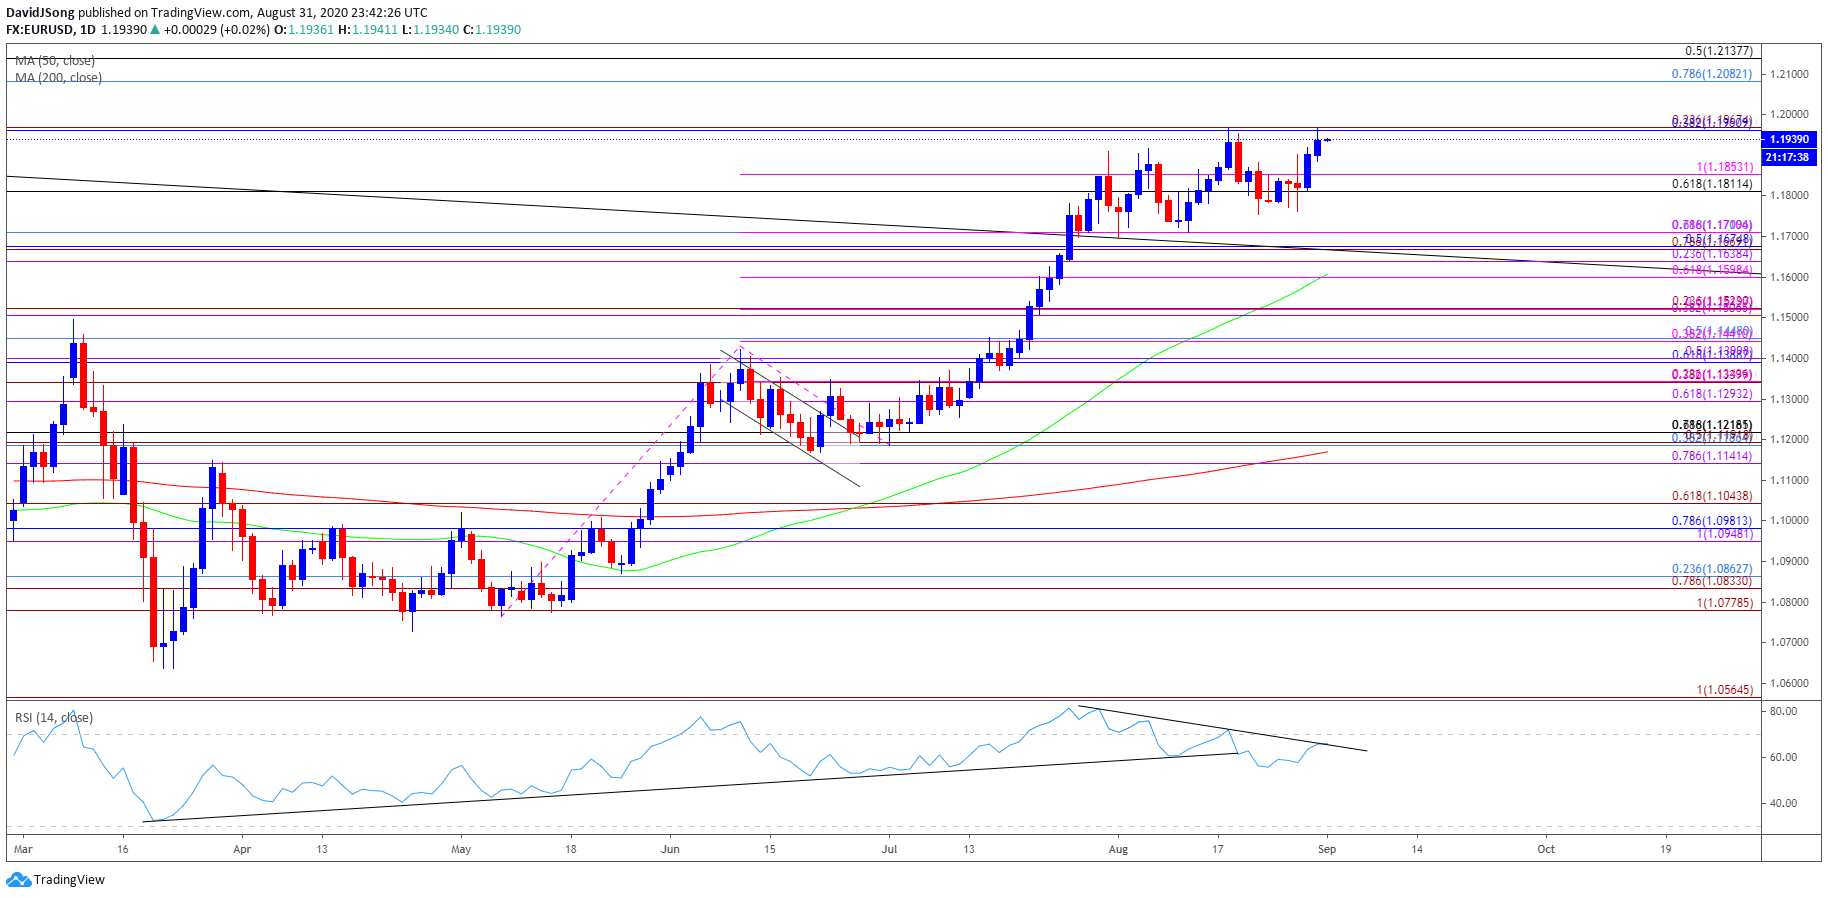
Source: Trading View
- Keep in mind, a ‘golden cross’ materialized in EUR/USD towards the end of June as the 50-Day SMA (1.1607) crossed above the 200-Day SMA (1.1170), with the moving averages extending the positive slopes into the second half of the year.
- At the same time, a bull flag formation panned out following the failed attempt to close below the 1.1190 (38.2% retracement) to 1.1220 (78.6% expansion) region in July, with the Relative Strength Index (RSI) helping to validate the continuation pattern as the oscillator bounced along trendline support to preserve the upward trend from March.
- However, the EUR/USD rally stalled following the failed attempt to break/close above the 1.1960 (38.2% retracement) to 1.1970 (23.6% expansion) region, with the RSI highlighting a similar dynamic as it slipped below 70 to flash a textbook sell signal.
- Nevertheless, future developments in the RSI may help to validate a near-term breakout in EUR/USD as the indicator threatens the downward trend established in August and approaches overbought territory, with a move above 70 likely to be accompanied by a further appreciation in the exchange rate like the behavior seen in July.
- Still need a close above the 1.1960 (38.2% retracement) to 1.1970 (23.6% expansion) region to bring the May 2018 high (1.1996) on the radar, with the next area of interest coming in around 1.2080 (78.6% retracement) to 1.2140 (50% retracement).

--- Written by David Song, Currency Strategist
Follow me on Twitter at @DavidJSong


