


Canadian Dollar Talking Points
USD/CAD takes out the March low (1.3315) ahead of the key data prints coming out of both the US and Canada, and an oversold reading in Relative Strength Index (RSI) is likely to be accompanied by a further depreciation in the exchange rate like the behavior seen in June.
USD/CAD Breaks Down From June Range While RSI Approaches Oversold Zone
USD/CAD carve a series of lower highs and lows as it breaks down from the June range, but it remains to be seen if the bearish price action will persist as Canada is expected to add 400K jobs in July, while the US Non-Farm Payrolls (NFP) report is anticipated to show a 1.6 million jump in employment during the same period.

In turn, the jobless rate for both the US and Canada should continue to fall, and the ongoing recovery in the labor market may encourage the Federal Reserve as well as the Bank of Canada (BoC) to retain the current course for monetary policy
As a result, the key data prints coming out of North American may do little to influence the near-term outlook for USD/CAD, and current market conditions may keep the exchange rate under pressure as the Relative Strength Index (RSI) approaches oversold territory.
The RSI is on the cusp of pushing below 30 even though it failed to retain the downward trend established in July, with an oversold reading likely to be accompanied by a further depreciation in USD/CAD like the behavior seen in June.
At the same time, the IG Client Sentiment report continues to reflect crowding behavior in the US Dollar, with retail traders net-long USD/CAD since mid-May. The latest update shows 63.92% of traders are still net-long USD/CAD, with the ratio of traders long to short at 1.77 to 1.
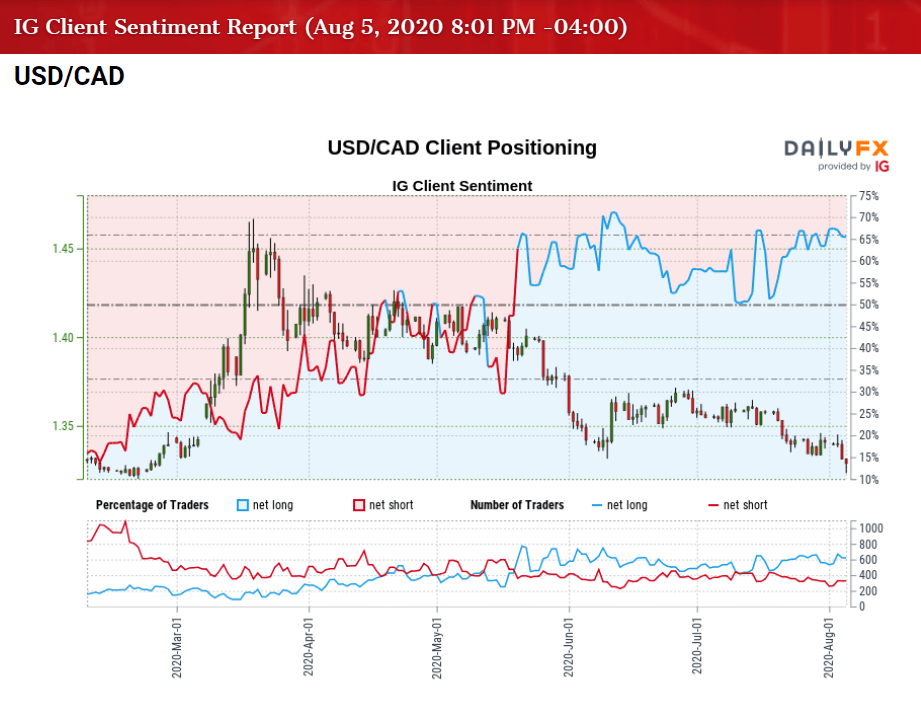
The number of traders net-long is 7.23% lower than yesterday and 11.14% lower from last week, while the number of traders net-short is 8.12% higher than yesterday and 9.02% lower from last week. The decline in net-long interest could indicate stop-loss orders are being triggered as USD/CAD takes out the March low (1.3315), while the recent rise in net-short position comes as the exchange rate carves a series of lower highs and lows.
With that said, the crowding behavior in the Greenback looks poised to persist ahead of the key data prints coming out of North America, and current market conditions may continue to drag on USD/CAD as it breaks down from the June range.

Sign up and join DailyFX Currency Strategist David Song LIVE for an opportunity to discuss potential trade setups.
USD/CAD Rate Daily Chart

Source: Trading View
- Keep in mind, the USD/CAD correction from the 2020 high (1.4667) managed to fill the price gap from March, with the decline in the exchange rate pushing the Relative Strength Index (RSI) into oversold territory for the first time since the start of the year.
- Nevertheless, USD/CAD reversed from the March low (1.3315) in June, with both price and the RSI carving an upward trend during the month, but the bullish formations have been largely negated as the exchange rate snapped the range bound price action during the first half of July.
- USD/CAD managed to track the June range throughout the previous month as the RSI broke out of the downward trend established in July, but the oscillator is now on the cusp of pushing below 30, with an oversold reading likely to be accompanied by a further depreciation in USD/CAD like the behavior seen in June.
- USD/CAD carves a series of lower highs and lows as it clears the March/June low (1.3315), but need a closing price below the 1.3250 (23.6% expansion) region to bring the 1.3170 (50% expansion) area on the radar.
- Next area of interest comes in around 1.3110 (50% expansion) followed by the Fibonacci overlap around 1.3030 (50% expansion) to 1.3040 (61.8% expansion).

--- Written by David Song, Currency Strategist
Follow me on Twitter at @DavidJSong


