


EUR/USD Rate Talking Points
The technical outlook for EUR/USD remains constructive going into the second half of 2020 as a bull flag formation takes shape, and the Relative Strength Index (RSI) may validate the pattern if the oscillator continues to track the bullish trend from earlier this year.
EUR/USD Rate Forecast: RSI to Validate Bull Flag Formation
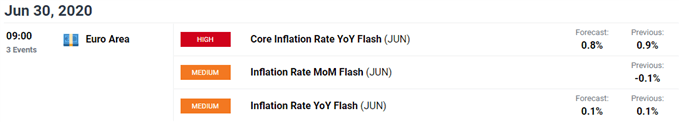
Looking ahead, fresh data prints coming out of the Euro Area may influence the near-term outlook for EUR/USD as the update to the Euro Zone Consumer Price Index (CPI) is anticipated to show the core rate of inflation narrowing to 0.8% from 0.9% per annum in May.
The development may drag on the Euro as it puts pressure on the European Central Bank (ECB) to further support the monetary union, and Governing Council officials may continue to rule out a V-shape recovery as the economy is expected to return to pre-pandemic conditions “at the end of 2022.”
However, a recent speech by ECB board member Yves Mersch suggests the central bank is in no rush to deliver additional monetary support as the official insist that “we would not need to make use of the full PEPP (pandemic emergency purchase programme) envelope if the Governing Council were to assess that market tensions had eased sufficiently.”
Mersch goes onto say that the a COVID-19 recovery fund “would reduce the burden on monetary policy and the need for further easing of the policy stance,” and efforts by fiscal authorities may push the ECB to the sidelines as European Council President Charles Michel vows to ‘start real negotiations with the member states, and will convene an in-person summit, around mid-July in Brussels.’
In turn, the ECB may merely attempt to buy time at the next meeting on July 16 even though the Governing Council stands ready to “adjust all of its instruments,” and the reluctance to implement lower interest rates may keep EUR/USD afloat as President Christine Lagarde and Co. appear to be on track to retain the current policy in the second half of the year.
With that said, EUR/USD may stage another attempt to test the March high (1.1495) as the exchange rate reverse ahead of the monthly low (1.1101), and a bull flag formation may unfold over the coming days as the Relative Strength Index (RSI) clings to the bullish trend from March.

Sign up and join DailyFX Currency Strategist David Song LIVE for an opportunity to discuss key themes and potential trade setups surrounding foreign exchange markets.
EUR/USD Rate Daily Chart

Source: Trading View
- Keep in mind, the monthly opening range was a key dynamic for EUR/USD in the fourth quarter of 2019 as the exchange rate carved a major low on October 1, with the high for November occurring during the first full week of the month, while the low for December happened on the first day of the month.
- The opening range for 2020 showed a similar scenario as EUR/USD marked the high of the month on January 2, with the exchange rate carving the February high during the first trading day of the month.
- However, the opening range for March was less relevant amid the pickup in volatility, with the pullback from the yearly high (1.1495) producing a break of the February low (1.0778) as the exchange rate slipped to a fresh 2020 low (1.0636).
- Nevertheless, EUR/USD appeared to be on track to test the March high (1.1495) after breaking out of the April range, but the exchange rate struggles to retain the advance from the start of June amid the failed attempt to close above the Fibonacci overlap around 1.1390 (61.8% retracement) to 1.1400 (50% expansion).
- It remains to be seen if a bull flag formation will unfold over the coming days asa ‘golden cross’ takes shape, with the 50-Day SMA (1.1051) crossing above the 200-Day SMA (1.1034) ahead of the second half of the year.
- The Relative Strength Index (RSI) may validate the patterns as if the oscillator continues to track the bullish trend from earlier this year, but failure to rebound from trendline support negates the scope for a bull flag formation as the development signals a potential shift in EUR/USD behavior.
- Lack of momentum to close above the 1.1340 (38.2% expansion) hurdle also undermines the scope for a continuation pattern as EUR/USD slips below the 1.1270 (50% expansion) to 1.1290 (61.8% expansion) region, with the exchange rate testing the Fibonacci overlap around 1.1190 (38.2% retracement) to 1.1220 (78.6% expansion) at the start of the week.
- Failure to hold above the 1.1190 (38.2% retracement) to 1.1220 (78.6% expansion) region may spur a move towards 1.1140 (78.6% expansion), with the next area of interest coming in around the 1.1100 (78.6% expansion) handle.
- Need a close above 1.1340 along with an extension of the bullish RSI formation to bring the 1.1390 (61.8% retracement) to 1.1400 (50% expansion) region on the radar, with the next area of interest coming in around 1.1430 (23.6% expansion) to 1.1450 (50% retracement), which largely lines up with the monthly high (1.1423).

--- Written by David Song, Currency Strategist
Follow me on Twitter at @DavidJSong


