


Gold Price Talking Points
The price of gold appears to be stuck in a narrow range following the string of failed attempt to test the November 2012 high ($1754), and the precious metal may consolidate ahead of the Federal Reserve interest rate decision on April 29 as it snaps the series of higher highs and lows from the previous week.
Gold Price Fails to Test November 2012 High Ahead of FOMC Meeting
The price of gold holds the monthly range as the Great Lockdown appears to have past its peak, and plans to gradually restart the advanced economies may generate a near-term correction in bullion as Italy looks to ease restrictions starting on May 4.
The US may soon follow as the Trump administration outlines a three-phased approach to reopen the economy, and the unprecedented response by fiscal authorities may encourage the Federal Open Market Committee (FOMC) to carry out its current policy as US lawmakers pass a $484B stimulus program to assist small businesses and hospitals through the pandemic.
In turn, the FOMC may revert to a wait-and-see approach as “the timing of the resumption of growth in the U.S. economy depended on the containment measures put in place,” but the central bank may keep the door open to implement more non-standard measures as officials saw “U.S. economic activity as likely to decline in the coming quarter and viewed downside risks to the economic outlook as having increased significantly.”
It remains to be seen if the dovish forward guidance will help to restore investor confidence as the FOMC pledges to “use its tools and act as appropriate to support the economy,” but the economic shock from COVID-19 may be felt throughout 2020 if the behaviors sparked by the lockdown laws become a new norm.
As a result, slowdown in global growth may lead to more historical events as major central banks push monetary policy into uncharted territory, and the low interest rate environment may continue to act as a backstop for goldas marketparticipants look for an alternative to fiat-currencies.
With that said, the flight to safety may keep gold prices afloat, and the broader outlook for bullion remains constructive as the reaction to the former-resistance zone around $1450 (38.2% retracement) to $1452 (100% expansion) helped to rule out the threat of a Head-and-Shoulders formation, with a similar scenario arising in March.
However, the price of bullion may consolidate over the remainder of the month amid the string of failed attempt to test the November 2012 high ($1754), with the Relative Strength Index (RSI) highlighting a similar dynamic as a bearish formation takes shape.
Sign up and join DailyFX Currency Strategist David Song LIVE for an opportunity to discuss potential trade setups.
Gold Price Daily Chart
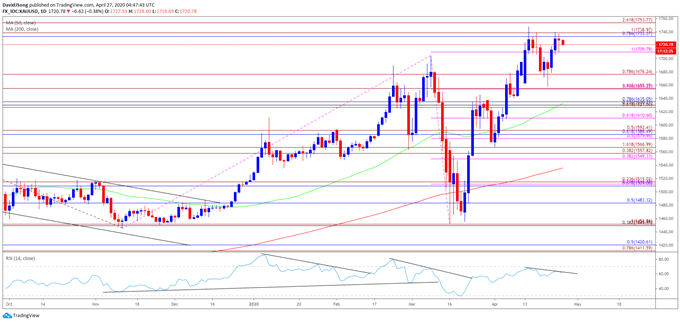
Source: Trading View
- The opening range for 2020 instilled a constructive outlook for the price of gold as the precious metal cleared the 2019 high ($1557), with the Relative Strength Index (RSI) pushing into overbought territory during the same period.
- A similar scenario materialized in February, with the price of gold marking the monthly low ($1548) during the first full week, while the RSI broke out of the bearish formation from earlier this year to push back into overbought territory.
- However, the monthly opening range for March as less relevant amid the pickup in volatility, with the decline from the monthly high ($1704) leading to a break of the January low ($1517).
- Nevertheless, the reaction to the former-resistance zone around $1450 (38.2% retracement) to $1452 (100% expansion) instilled a constructive outlook for bullion especially as the RSI reversed course ahead of oversold territory and broke out of the bearish formation carried over from the previous month.
- The break/close above $1710 (100% expansion) pushed the price of gold to a fresh yearly high ($1748), but the precious metal continues to track the range from earlier this month amid the lack of momentum to test the November 2012 high ($1754).
- The Relative Strength Index (RSI) highlights a similar dynamic as a bearish formation takes shape following the failed attempts to push into overbought territory.
- In turn, the price of gold may consolidate over the remainder of the month amid the string of failed attempt to close above the Fibonacci overlap around $1733 (78.6% retracement) to $1739 (100% expansion), with a move below the $1710 (100% expansion) region bringing the $1676 (78.6% expansion) area on the radar.
- Next area of interest comes in around $1655 (78.6% expansion) followed by the Fibonacci overlap around $1627 (61.8% expansion) to $1635 (78.6% retracement).

--- Written by David Song, Currency Strategist
Follow me on Twitter at @DavidJSong


