


Oil Price Talking Points
The price of oil appears to be turning around ahead of the October low ($50.99), and the Relative Strength Index (RSI) may flash a textbook buy signal over the coming days if the oscillator bounces back from oversold territory.
Oil Price to Stage Rebound on Textbook RSI Buy Signal
The price of oil holds above the monthly low ($52.13) despite a larger-than-expected rise in US crude inventories, and the limited reaction may give way to range bound prices as the Organization of the Petroleum Exporting Countries (OPEC) continue to regulate the energy market.
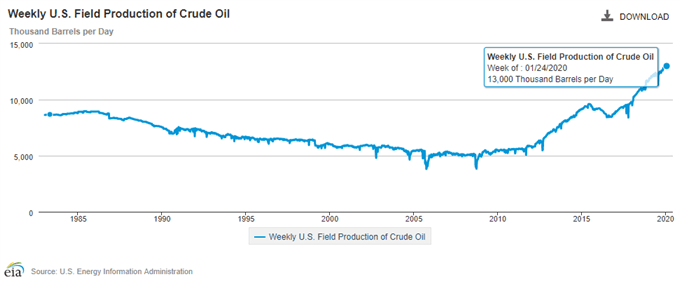
US stockpiles increased 3548K in the week ending January 24 compared to forecasts for a 1290K rise, with the recent figures coming out of the Energy Information Administration (EIA) showing weekly field production of crude sitting at the record high of 13,000K for the third consecutive week.
OPEC and its allies may continue to counter the rise in US output amid their commitment to the ‘Declaration of Cooperation,” and the group may carry out its efforts throughout 2020 amid the weakening outlook for global growth.
It remains to be seen if OPEC and its allies will make a meaningful announcement at the next meeting in March as the US and China, the two largest consumers of oil, sign the Phase One trade deal, and the group may vote to extend the production-cutting measures as they agreed to reduce output by another 500K b/d following the last conference in December.

In turn, the narrowing threat of a US-China trade war along with the commitment to the ‘Declaration of Cooperation’ may act as a backstop for oil prices, with the failed attempt to test the October low ($50.99) raising the scope for a near-term rebound in crude especially if the Relative Strength Index (RSI) flashes a textbook buy signal.
Sign up and join DailyFX Currency Strategist David Song LIVE for an opportunity to discuss key themes and potential trade setups.
Crude Oil Daily Chart
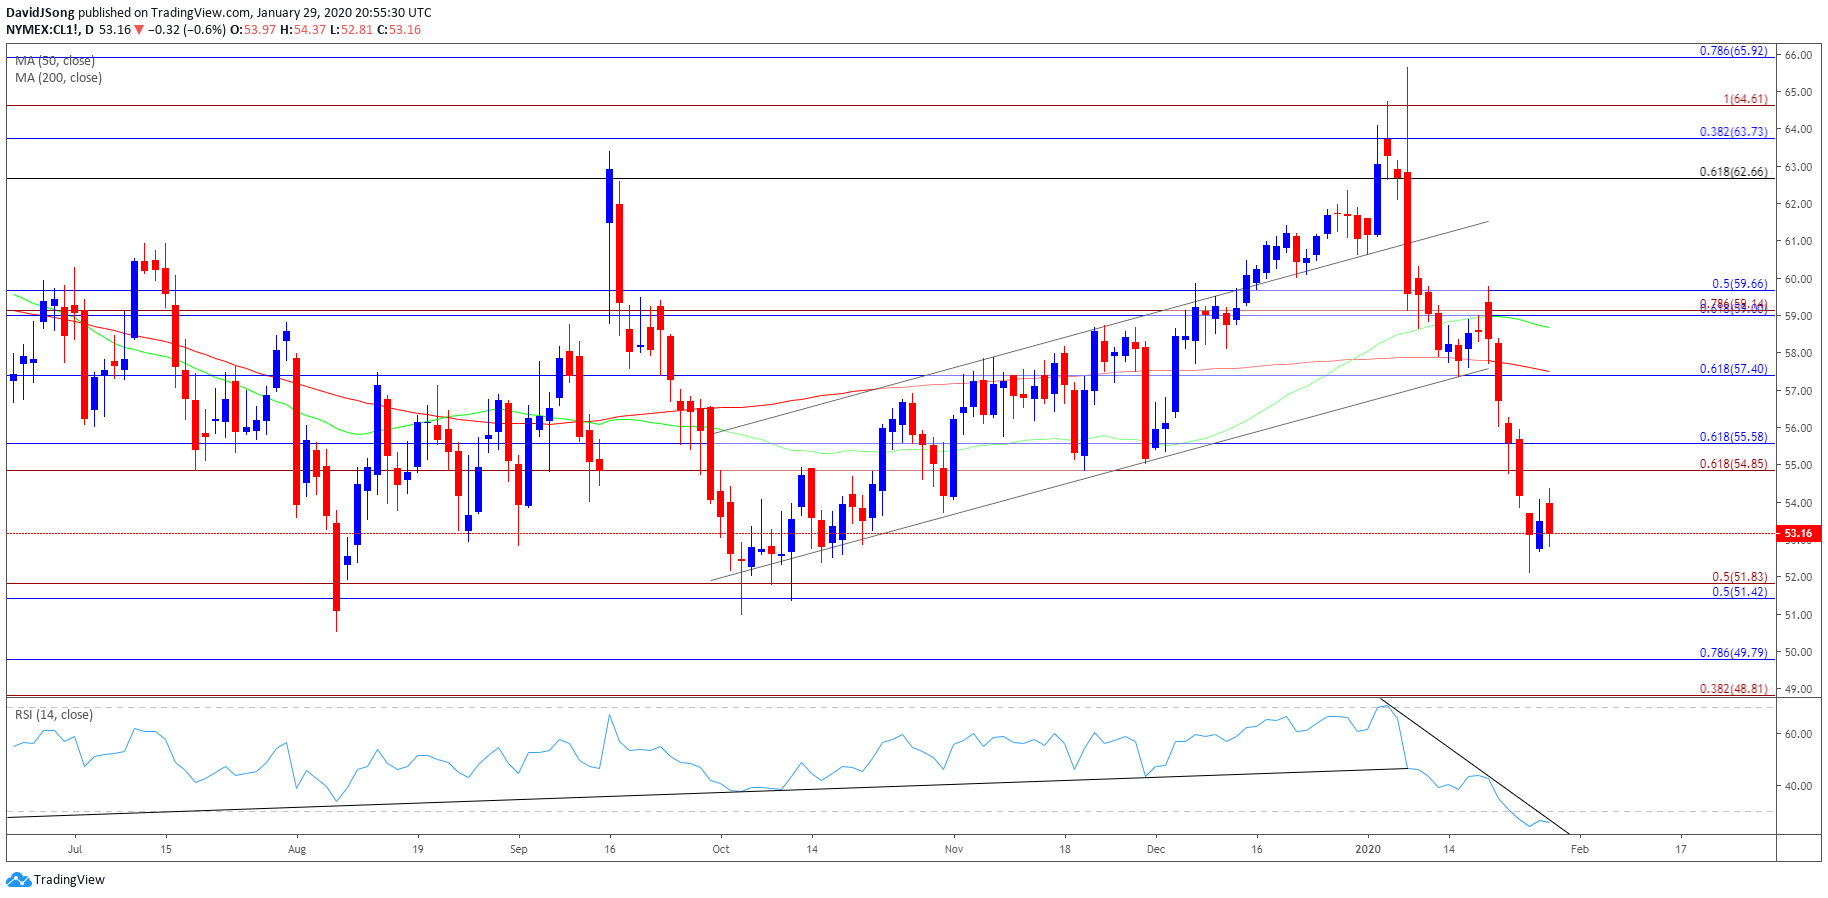
Source: Trading View
- The price of crude has given back the advance from late last year following the failed attempt to test the 2019 high ($66.60), with the Relative Strength Index (RSI) carving a bearish trend and pushing into oversold for the first time since June.
- A ‘golden cross’ formation took shape just ahead of 2020 as the 50-Day SMA crossed above the 200-Day SMA, but the flattening slope across the moving averages warns of rang bound conditions as the recent decline appears to have stalled ahead of the October low ($50.99).
- Will keep a close eye on the RSI as it sits in oversold territory, but the oscillator may flash a textbook buy signal over the coming days if it breaks out of the bearish formation from the start of the year.
- Lack of momentum to break/close below the $51.40 (50% retracement) to $51.80 (50% expansion) region may spur a move towards the Fibonacci overlap around $54.90 (61.8% expansion) to $55.60 (61.8% retracement), with the next area of interest coming in around $57.40 (61.8% retracement).

--- Written by David Song, Currency Strategist
Follow me on Twitter at @DavidJSong.


