


Gold Price Talking Points
The price of gold appears to have marked a failed run at the yearly high ($1611), with recent developments in the Relative Strength Index (RSI) offering a mixed outlook ahead of the Federal Reserve interest rate decision as the oscillator falls back from overbought territory and threatens the upward trend from December.
Gold Price Outlook Hinges on FOMC Forward Guidance
The price of gold consolidates going into the Federal Reserve’s first meeting for 2020, but it remains to be seen if the interest rate decision will spark a major reaction as the central bank is widely expected to keep the benchmark interest rate in its current threshold of 1.50% to 1.75%.
In turn, market participants are likely to pay increased attention to the forward guidance for monetary policy as the Federal Open Market Committee (FOMC) moves away from its rate easing cycle and endorses a wait-and-see approach after delivering three consecutive rate cuts in 2019.
The FOMC may stick to the status quo as the US and France reach a trade truce, and Chairman Jerome Powell and Co. may merely attempt to buy time even though President Donald Trump tweets that the Fed should “lower the Rate to make our interest competitive with other Countries.”
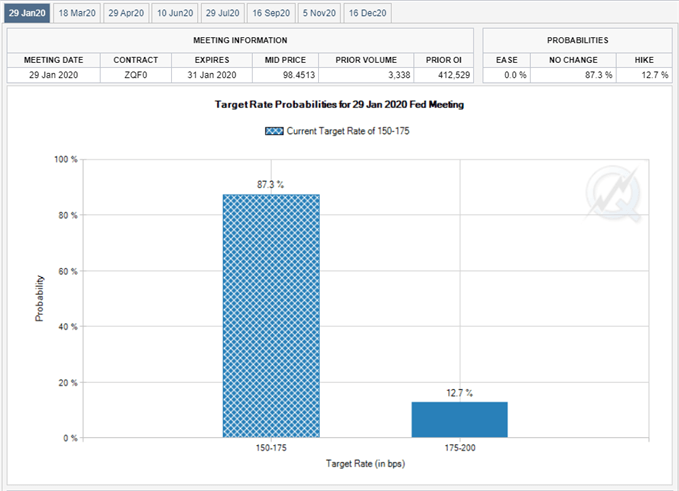
With the Phase One of the US-China trade deal in place, Fed Fund futures continue to show a greater than 80% probability the FOMC will retain the current policy in January 29, and more of the same from the Fed may do little to alter the outlook for gold prices as “participants regarded the current stance of monetary policy as likely to remain appropriate for a time.”
However, the ongoing shift in US trade policy may push Fed officials to adjust the forward guidance when the central bank updates the Summary of Economic Projections (SEP) in March as the Trump administration remains reluctant to rollback tariffs.
As a result, the weakening outlook for global growth along with the lingering threat of a trade war may put pressure on the FOMC to further insulate the US economy, and a batch of dovish comments may heighten the appeal of gold as market participants look for an alternative to fiat-currencies.
With that said, the broader outlook for the price of gold remains constructive, with the reaction to the former-resistance zone around $1447 (38.2% expansion) to $1457 (100% expansion) helping to rule out the threat of a Head-and-Shoulders formation as the region acts as support.

However, the recent advance in the precious metal appears to have stalled ahead of the yearly high ($1611) as the Relative Strength Index (RSI) falls back from overbought territory and threatens the bullish formation from December.
Sign up and join DailyFX Currency Strategist David Song LIVE for an opportunity to discuss potential trade setups.
Gold Price Daily Chart
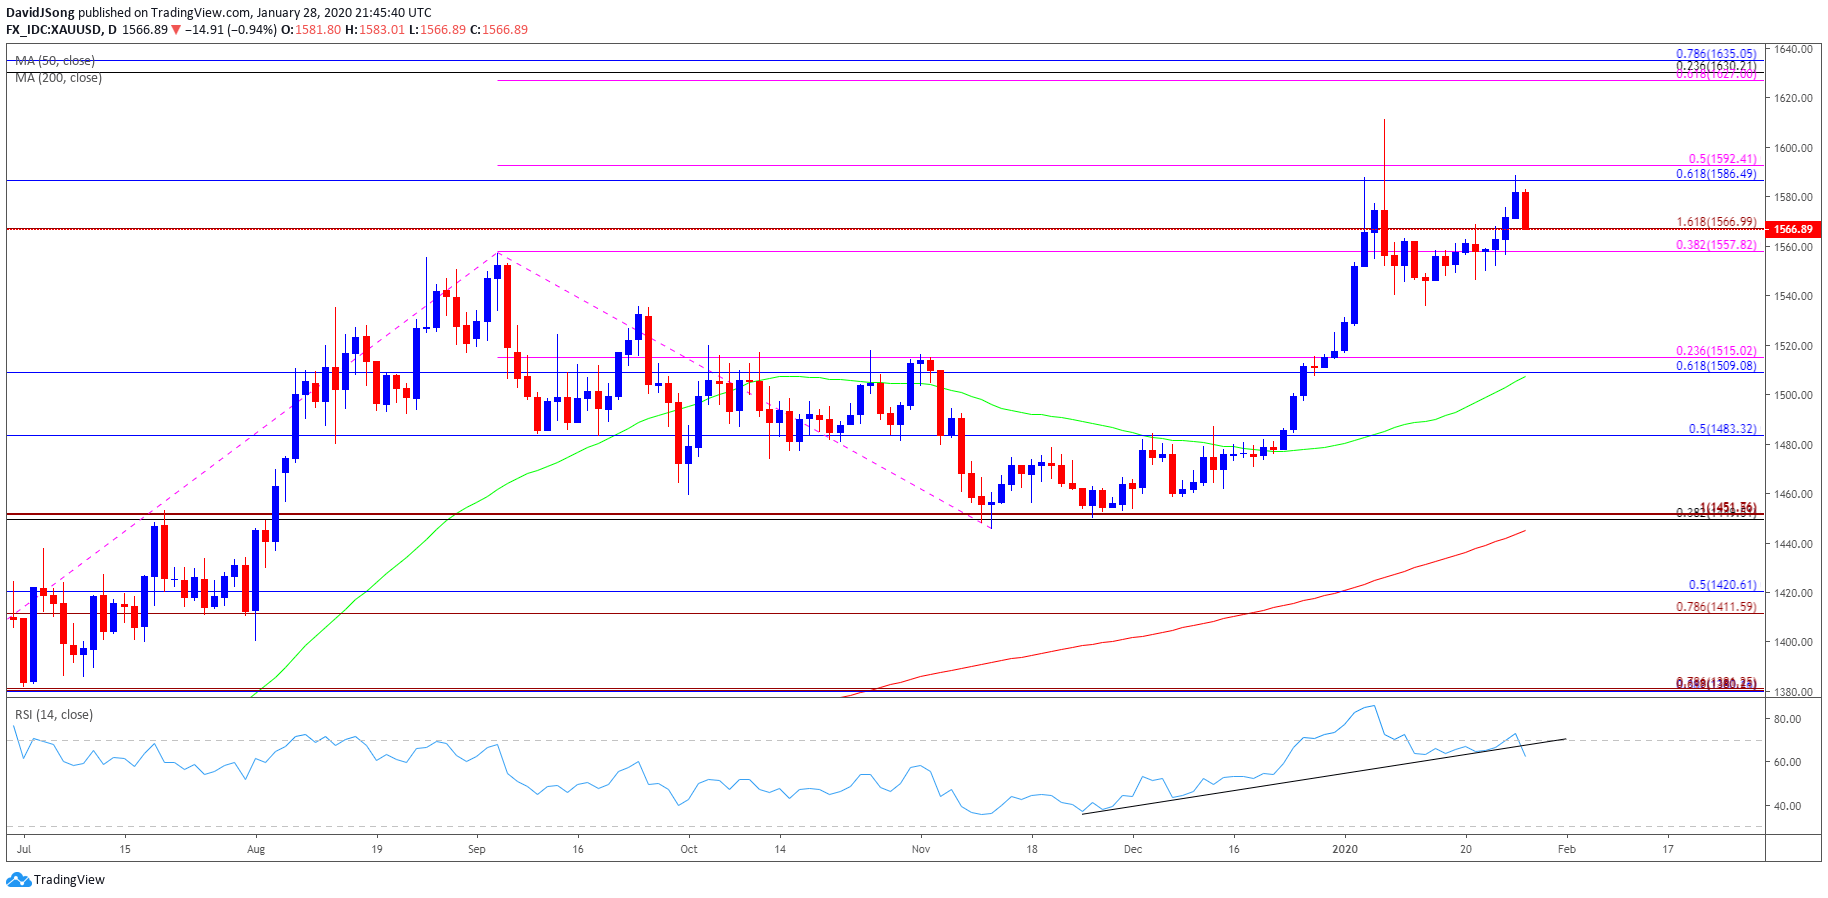
Source: Trading View
- The opening range for 2020 instills a constructive outlook for the price of gold as the precious metal clears the 2019 high ($1557), with the recent pullback in the precious metal failing to trigger a test of the monthly low ($1517).
- However, recent developments in the Relative Strength Index (RSI) suggests the bullish momentum from the end of 2019 will continue to abate as the oscillator struggles to retain the upward trend from December.
- Lack of momentum to test the yearly high ($1611) raises the risk for a larger pullback, with failure to break/close above the Fibonacci overlap around $1587 (61.8% retracement) to $1592 (50% expansion) raising the scope for a move towards the $1558 (38.2% expansion) to $1567 (161.8% expansion) region.
- Next area of interest comes in around $1509 (61.8% retracement) to $1515 (23.6% expansion), which largely lines up with the monthly low ($1517).

--- Written by David Song, Currency Strategist
Follow me on Twitter at @DavidJSong.


