


Gold Price Talking Points
The price of gold clears the 2019 high ($1557) following the US airstrike on Iran, and the precious metal may exhibit a more bullish behavior over the coming days as the Relative Strength Index (RSI) sits in overbought territory.
Gold Price Clears 2019 High & Triggers Overbought RSI Reading
The price of gold trades at its highest level since 2013 as Iran pledges to retaliate to the death of general Qassim Soleimani, and the conflict may keep gold prices afloat as President Donald Trump insist that “the United States will quickly & fully strike back, & perhaps in a disproportionate manner.”
The threat of war along with the ongoing shift in US trade policy may continue to impact financial markets especially as the Office of the United States Trade Representative (USTR) initiates “a process to assess increasing the tariff rates and subjecting additional EU products to the tariffs.”
It seems as though the Trump administration will remain reliant on tariffs and sanctions to achieve its agenda, and the weakening outlook for global growth may push market participants to hedge against fiat currencies as it puts pressure on major central banks to provide additional monetary support.
In turn, the Federal Reserve may have little choice but to reestablish its rate easing cycle in 2020 as the central bank pledges to “respond accordingly” to the economic outlook.
Recent remarks from Cleveland Fed President Loretta Mester, a 2020 voting-member on the Federal Open Market Committee (FOMC), suggest the central bank is in no rush to further insulate the US economy as “the underlying fundamentals are still strong,” but the Federal Reserve may keep the door open to implement lower interest rates as “trade tensions are going to remain” a drag on economic activity.
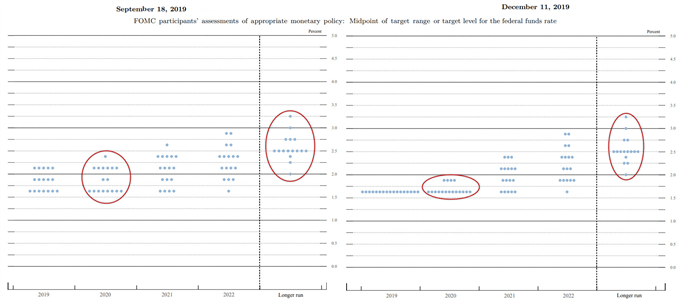
As a result, Chairman Jerome Powell and Co. may project a lower trajectory for the benchmark interest rate when the central bank updates the Summary of Economic Projections (SEP) in March as “various participants were concerned that indicators were suggesting that the level of longer-term inflation expectations was too low.”
With that said, Fed officials may change their tune over the coming months, and speculation for lower interest rates along with the weakening outlook for global growth may keep gold prices afloat as market participants look for an alternative to fiat-currencies.
Sign up and join DailyFX Currency Strategist David Song LIVE for an opportunity to discuss potential trade setups.
Gold Price Daily Chart

Source: Trading View
- Keep in mind, the broader outlook for gold prices remain constructive following the reaction to the former-resistance zone around $1447 (38.2% expansion) to $1457 (100% expansion), with the development helping to rule out the threat of a Head-and-Shoulders formation as the region appears to be acting as support.
- Topside targets are on the radar for gold as it clears the 2019 high ($1557), while the Relative Strength Index (RSI) extends the bullish formation from December and holds in overbought territory.
- A close above $1570 (161.8% expansion) raises the scope for a more meaningful run at the $1591 (50% expansion) region, with the next area of interest coming in around $1625 (61.8% expansion) to $1634 (78.6% retracement).
- Will keep a close eye on the Fibonacci overlap around $1554 (100% expansion) to $1557 (38.2% expansion) as the former-resistance zone may offer support over the coming days.
For more in-depth analysis, check out the 1Q 2020 Forecast for Gold
Additional Trading Resources
Are you looking to improve your trading approach? Review the ‘Traits of a Successful Trader’ series on how to effectively use leverage along with other best practices that any trader can follow.
Want to know what other currency pairs the DailyFX team is watching? Download and review the Top Trading Opportunities for 2020.
--- Written by David Song, Currency Strategist
Follow me on Twitter at @DavidJSong.


