


Gold Price Talking Points
The price of gold remains under pressure as President Donald Trump announces ‘phase one’ of the US-China trade deal, with the precious metal at risk of giving back the advance from the start of the month asthe Relative Strength Index (RSI) continues to track the bearish formation carried over from June.
Gold Prices Eye Monthly-Low Despite Bets for Fed Rate Cut
Gold approaches the October-low ($1459) as the US-China trade war appears to be coming to an end, and failure to preserve the monthly opening range may spur a larger correction as the near-term outlook remains mired by a head-and-shoulders formation.
The trade truce appears to be fueling risk-taking behavior as equity indices show a bullish reaction to the announcement, and it seems as though more details will be revealed over the coming days as President Trump tweets that “the phase one deal can be finalized & signed soon.”
Indications of an imminent US-China trade deal may continue to sap the appeal of gold as it limits the Federal Open Market Committee’s (FOMC) scope to support the US economy with lower interest rates. In fact, recent comments from Fed officials suggest the central bank will revert to a wait-and-see approach following the back-to-back rate cuts amid the growing dissent within the FOMC.
Boston Fed President Eric Rosengren insists “policymakers can be patient and continue to evaluate incoming data before taking additional action” as the current stance is “already accommodative.” The 2019 voting-member on the FOMC goes onto say that “the economy has evolved about as expected, despite the unanticipated increase in tariffs and the slower growth of exports and business fixed investment.”
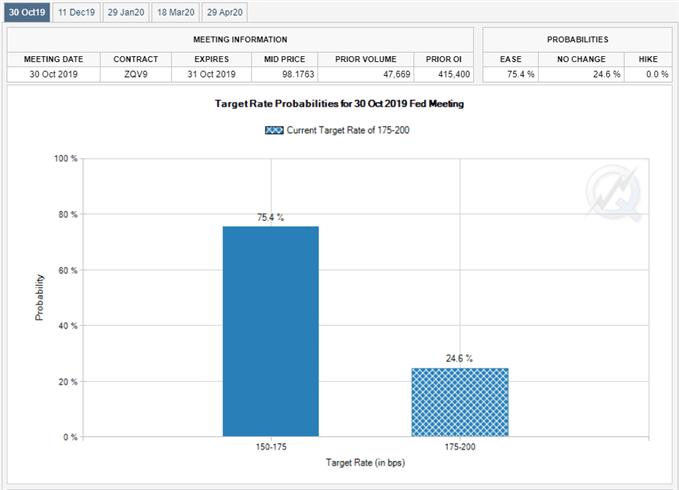
Mr. Rosengren adds that the “recent monetary policy easing is likely to provide some stimulus over the next several quarters,” but Fed Fund Futures continue to show a greater than 70% probability for another 25bp reduction on October 30, with President Trump arguing that “the Federal Reserve should cut rates regardless of this deal.”
It remains to be seen if the FOMC will continue to reverse the four rate hikes from 2018 as Fed officials see the benchmark interest rate around 1.50% to 1.75% ahead of 2020, but the growing divide at the central bank may heighten the appeal of gold amid the threat of a policy error.
In turn, fears of a global recession paired with the inverting US yield curve may push market participants to hedge against fiat-currencies, but the near-term outlook for gold remains mired by a head-and-shoulders formation, with the precious metal at risk for a larger correction as the Relative Strength Index (RSI) continues to track the bearish formation from June.
Sign up and join DailyFX Currency Strategist David Song LIVE for an opportunity to discuss potential trade setups.
Gold Price Daily Chart
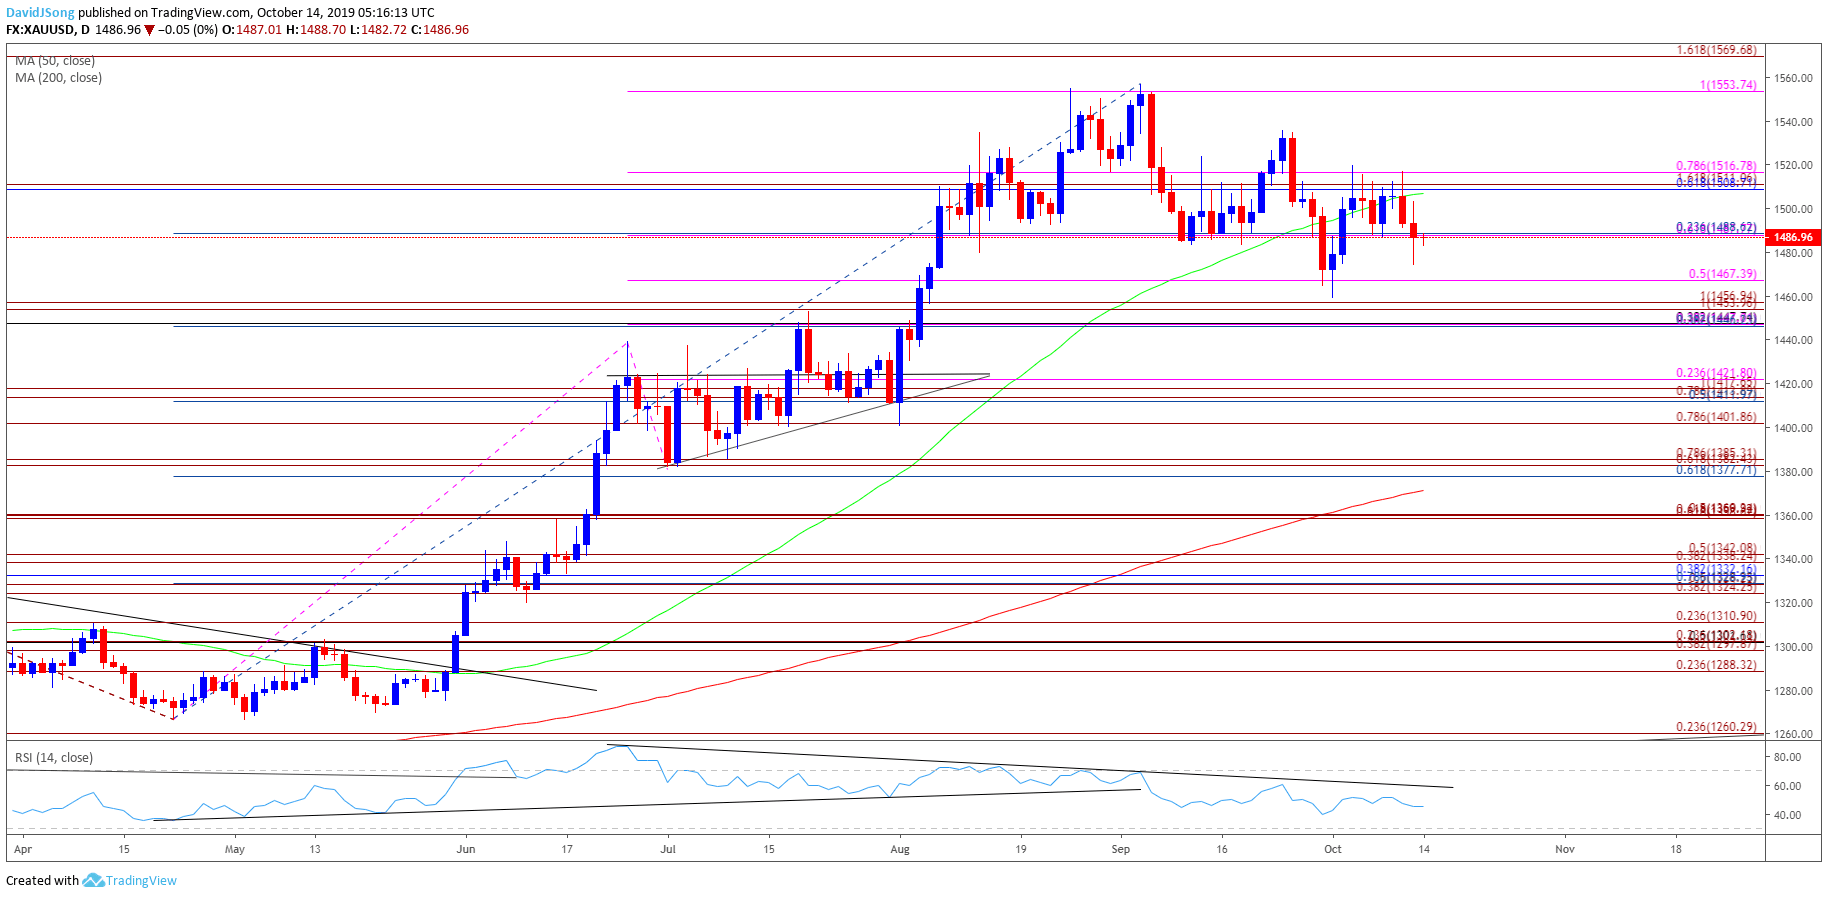
Source: Trading View
- The broader outlook for gold prices remain constructive as both price and the Relative Strength Index (RSI) clear the bearish trends from earlier this year, with the precious metal trading to a fresh yearly-high ($1557) in September.
- However, recent developments in the RSI warns of a near-term correction in gold as the oscillator continues to track the downward trend from June, with recent price action raising the risk for a head-and-shoulders top.
- The string of failed attempts to close above the Fibonacci overlap around $1509 (61.8% retracement) to $1517 (78.6% expansion) keeps the downside targets on the radar, with the move below $1488 (61.8% expansion) bringing up the $1468 (50% expansion) region.
- Failure to hold above the monthly-low ($1459) may open up the overlap around $1447 (38.2% expansion) to $1457 (100% expansion), with the next area of interest coming in around $1412 (50% retracement) to $1422 (23.6% expansion).
For more in-depth analysis, check out the 4Q 2019 Forecast for Gold
Additional Trading Resources
Are you looking to improve your trading approach? Review the ‘Traits of a Successful Trader’ series on how to effectively use leverage along with other best practices that any trader can follow.
Want to know what other currency pairs the DailyFX team is watching? Download and review the Top Trading Opportunities for 2019.
--- Written by David Song, Currency Strategist
Follow me on Twitter at @DavidJSong.


