


Oil Price Talking Points
The near-term outlook for crude remains battered even though the Organization of the Petroleum Exporting Countries (OPEC) pledge to regulate the energy market throughout 2019, and the price of oil stands at risk of extending the decline from the start of the month as a ‘death-cross’ formation takes shape.
Oil Price Weakness to Persist as US-China Trade Negotiation Stalls
The extension of the OPEC+ alliance has largely failed to prop up the price of crude, and the ongoing trade dispute between the US and China, the two largest consumers of oil, may continue to drag on crude prices amid the weakening outlook for global growth.
It seems as though the negotiations have once again stalled following the Group of 20 (G20) summit as the Commerce Department announces it will “instruct U.S. Customs and Border Protection to collect cash deposits from importers of fabricated structural steel from China and Mexico.”
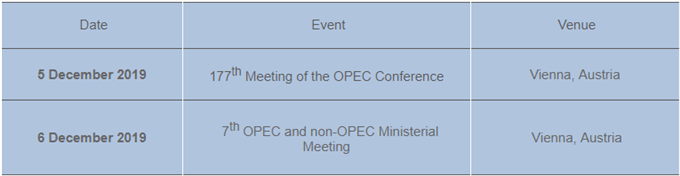
The ongoing shift in US trade policy may force OPEC and its allies to further clamp down on production especially as the most recent Monthly Oil Market Report (MOMR) indicates slower consumption for 2019, and it remains to be seen if the group may announce additional measures ahead of the next meeting in December as US crude output increases for the first time since May.
Until then, current market conditions may continue to drag on crude, with the price of oil still at risk of facing a bear market as a ‘death-cross’ formation takes shape.
Crude Oil Daily Chart
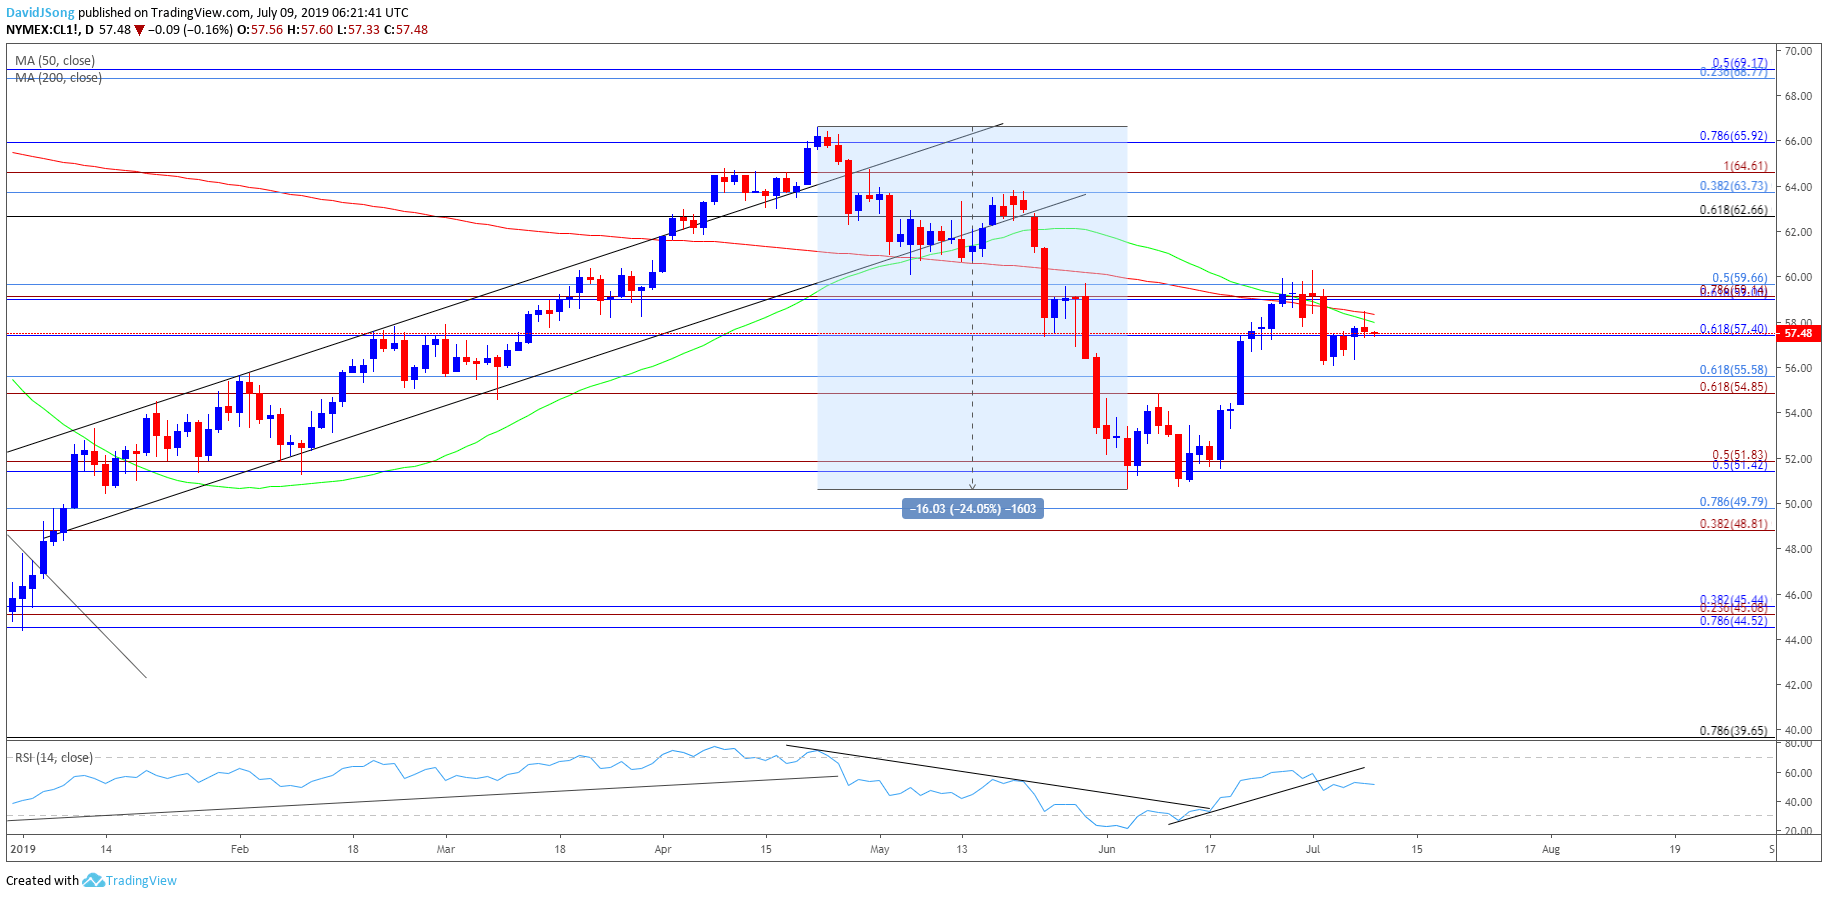
- Keep in mind, the broader outlook for crude oil is no longer constructive as both price and the Relative Strength Index (RSI) snap the bullish trends from earlier this year.
- At the same time, a ‘death cross’ formation has taken shape as the 50-Day SMA ($58.00) crosses below the 200-Day SMA ($58.35), with both moving averages tracking a negative slope.
- The string of failed attempts to close above the Fibonacci overlap around $59.00 (61.8% retracement) to $59.70 (50% retracement) brings the $54.90 (61.8% expansion) to $55.60 (61.8% retracement) region on the radar especially as the RSI snaps the upward trend carried over from the previous month.
- Next downside hurdle comes in around $51.40 (50% retracement) to $51.80 (50% expansion) followed by the Fibonacci overlap around $48.80 (38.2% expansion) to $49.80 (78.6% retracement).
Sign up and join DailyFX Currency Strategist David Song LIVE for an opportunity to discuss key themes and potential trade setups.
For more in-depth analysis, check out the 3Q 2019 Forecast for Oil
Additional Trading Resources
Are you looking to improve your trading approach? Review the ‘Traits of a Successful Trader’ series on how to effectively use leverage along with other best practices that any trader can follow.
Want to know what other markets the DailyFX team is watching? Download and review the Top Trading Opportunities for 2019.
--- Written by David Song, Currency Strategist
Follow me on Twitter at @DavidJSong.


