


Oil Price Talking Points
Oil prices have failed to retain the advance following the Group of 20 (G20) summit, and the advance from the June-low ($50.60) may continue to unravel as a ‘death-cross’ formation takes shape.
Crude Oil Price Outlook Mired by Death Cross Formation
The recent weakness in the price of oil appears to be catching traders off guard as the Organization of the Petroleum Exporting Countries (OPEC) and its allies plan to regulate the energy market well into 2020.
It seems as though the extension of the OPEC+ alliance was not enough to keep oil prices afloat amid the weakening outlook for global growth, and the group may have little choice but to clamp down on production especially as the US and China, the two largest consumers of crude, struggle to reach a trade deal.
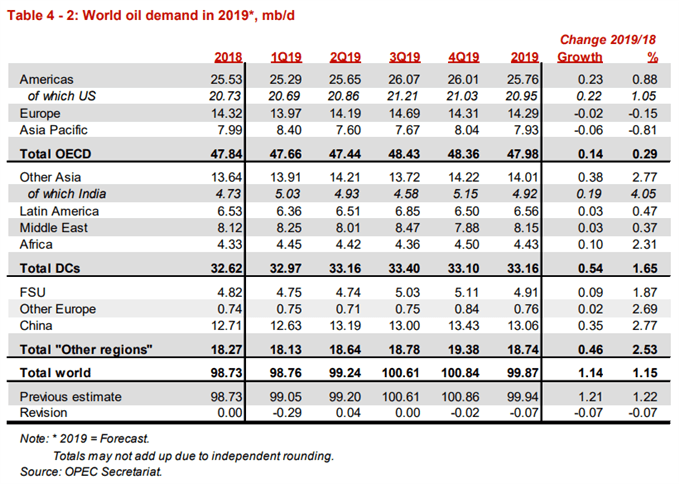
In turn, OPEC and its allies may take additional steps to balance the energy market as the most recent Monthly Oil Market Report (MOMR) highlights slower consumption for 2019.
Until then, the lack of urgency to further reduce outputs may continue to drag on crude, with recent developments raising the risk for lower oil prices as a ‘death-cross takes shape.’
Crude Oil Daily Chart
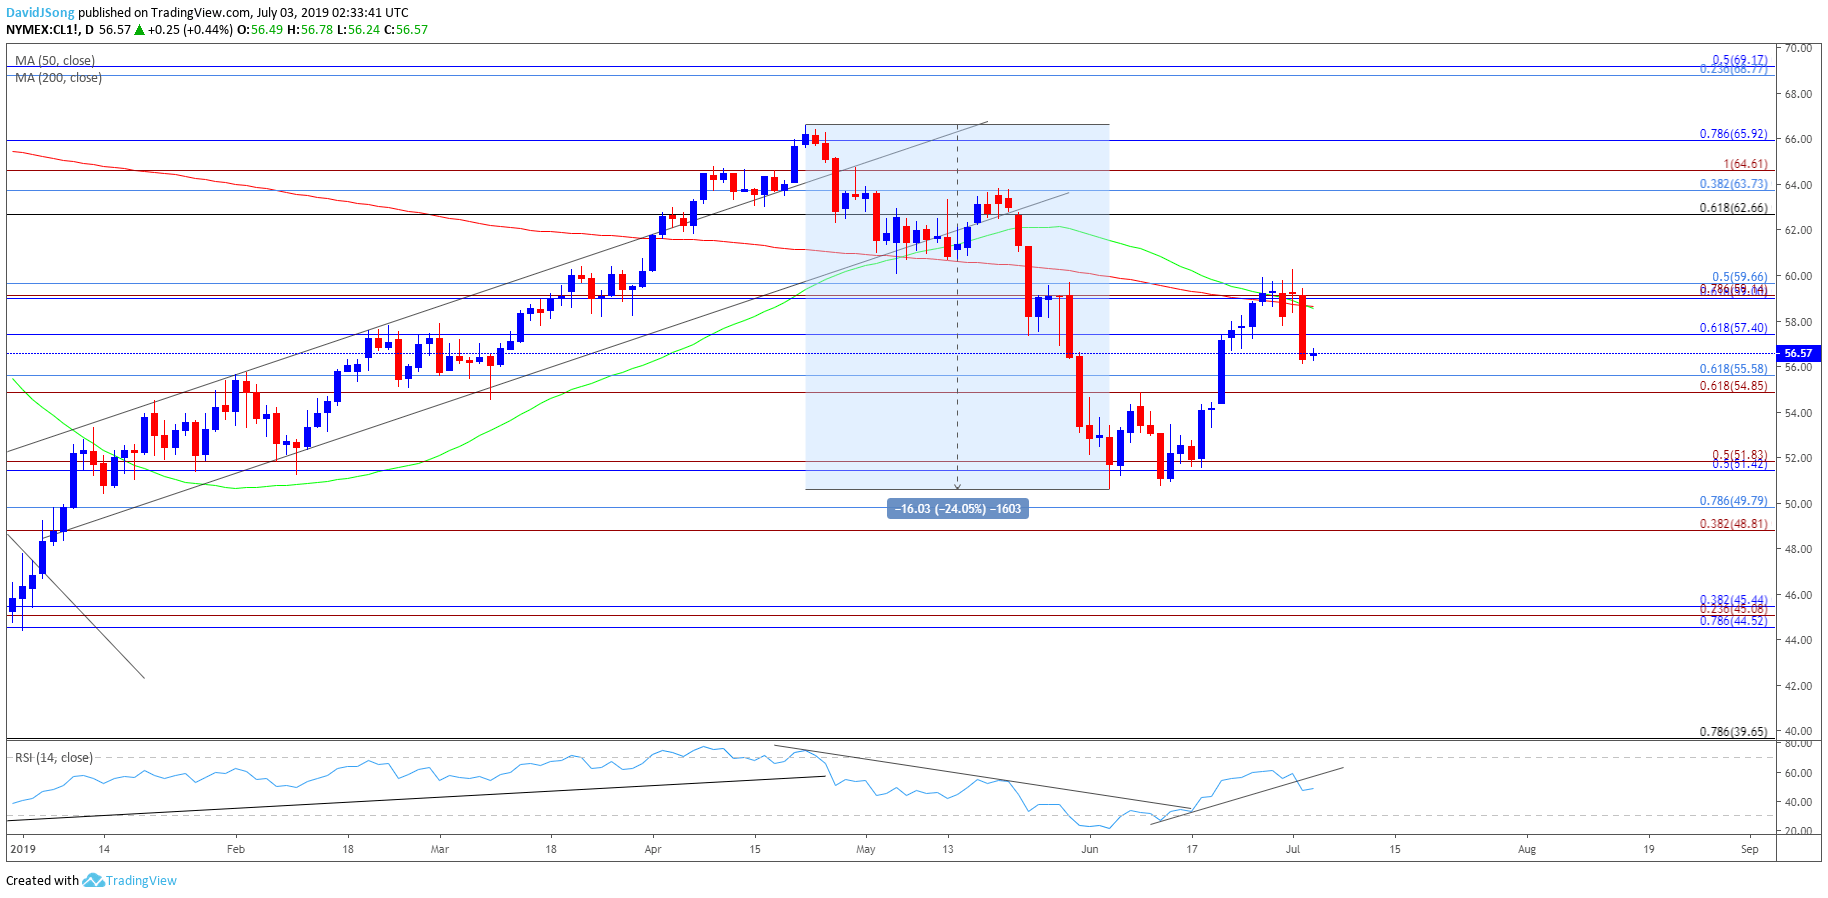
- Keep in mind, the broader outlook for crude oil is no longer constructive as both price and the Relative Strength Index (RSI) snap the bullish trends from earlier this year.
- At the same time, a ‘death cross’ formation has taken shape as the 50-Day SMA ($58.54) crosses below the 200-Day SMA ($58.62), with both moving averages tracking a negative slope.
- The string of failed attempts to close above the Fibonacci overlap around $59.00 (61.8% retracement) to $59.70 (50% retracement) has pushed crude prices back below the $57.40 (61.8% retracement) pivot, with the next area of interest coming in around $54.90 (61.8% expansion) to $55.60 (61.8% retracement).
- Next downside hurdle comes in around $51.40 (50% retracement) to $51.80 (50% expansion) followed by the overlap around $48.80 (38.2% expansion) to $49.80 (78.6% retracement).
- The RSI also offers a bearish signal as the oscillator snaps the upward trend carried over from the previous month.
Sign up and join DailyFX Currency Strategist David Song LIVE for an opportunity to discuss key themes and potential trade setups.
For more in-depth analysis, check out the 3Q 2019 Forecast for Oil
Additional Trading Resources
Are you looking to improve your trading approach? Review the ‘Traits of a Successful Trader’ series on how to effectively use leverage along with other best practices that any trader can follow.
Want to know what other markets the DailyFX team is watching? Download and review the Top Trading Opportunities for 2019.
--- Written by David Song, Currency Strategist
Follow me on Twitter at @DavidJSong.


