


Oil Price Talking Points
Crude gives back the rebound from earlier this week even though US oil inventories contract for the third consecutive week, and the advance from the June-low ($50.60) may continue to unravel as a ‘death-cross’ formation takes shape.
Oil Price Rebound Fizzles Following Uptick in US Crude Production
The recent weakness in the price of oil looks poised to persist despite the 1085K decline in US stockpiles as crude production increases for the first time since May.
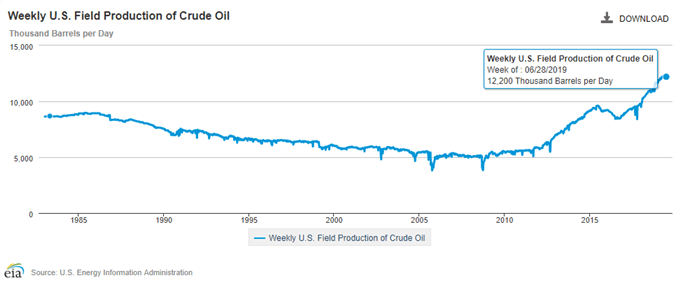
Weekly field production of crude oil climbed to 12,200K from 12,100K in the week ending June 21, and the pickup in US output may become a growing concern for the Organization of the Petroleum Exporting Countries (OPEC) and its allies as the group pledges to regulate the energy market well into 2020.
It seems as though OPEC and its allies will have little choice but to clamp down on production as the most recent Monthly Oil Market Report (MOMR) indicates slower consumption for 2019, and the group may take additional steps over the coming months as the mere extension of the OPEC+ alliance fails to keep oil prices afloat.
At the same time, it remains to be seen if the US and China, the two largest consumers of oil, will reach a trade agreement as President Donald Trump tweets “China and Europe playing big currency manipulation game,” and current market conditions may keep oil prices under pressure especially as a ‘death-cross’ formation takes shape.
Crude Oil Daily Chart
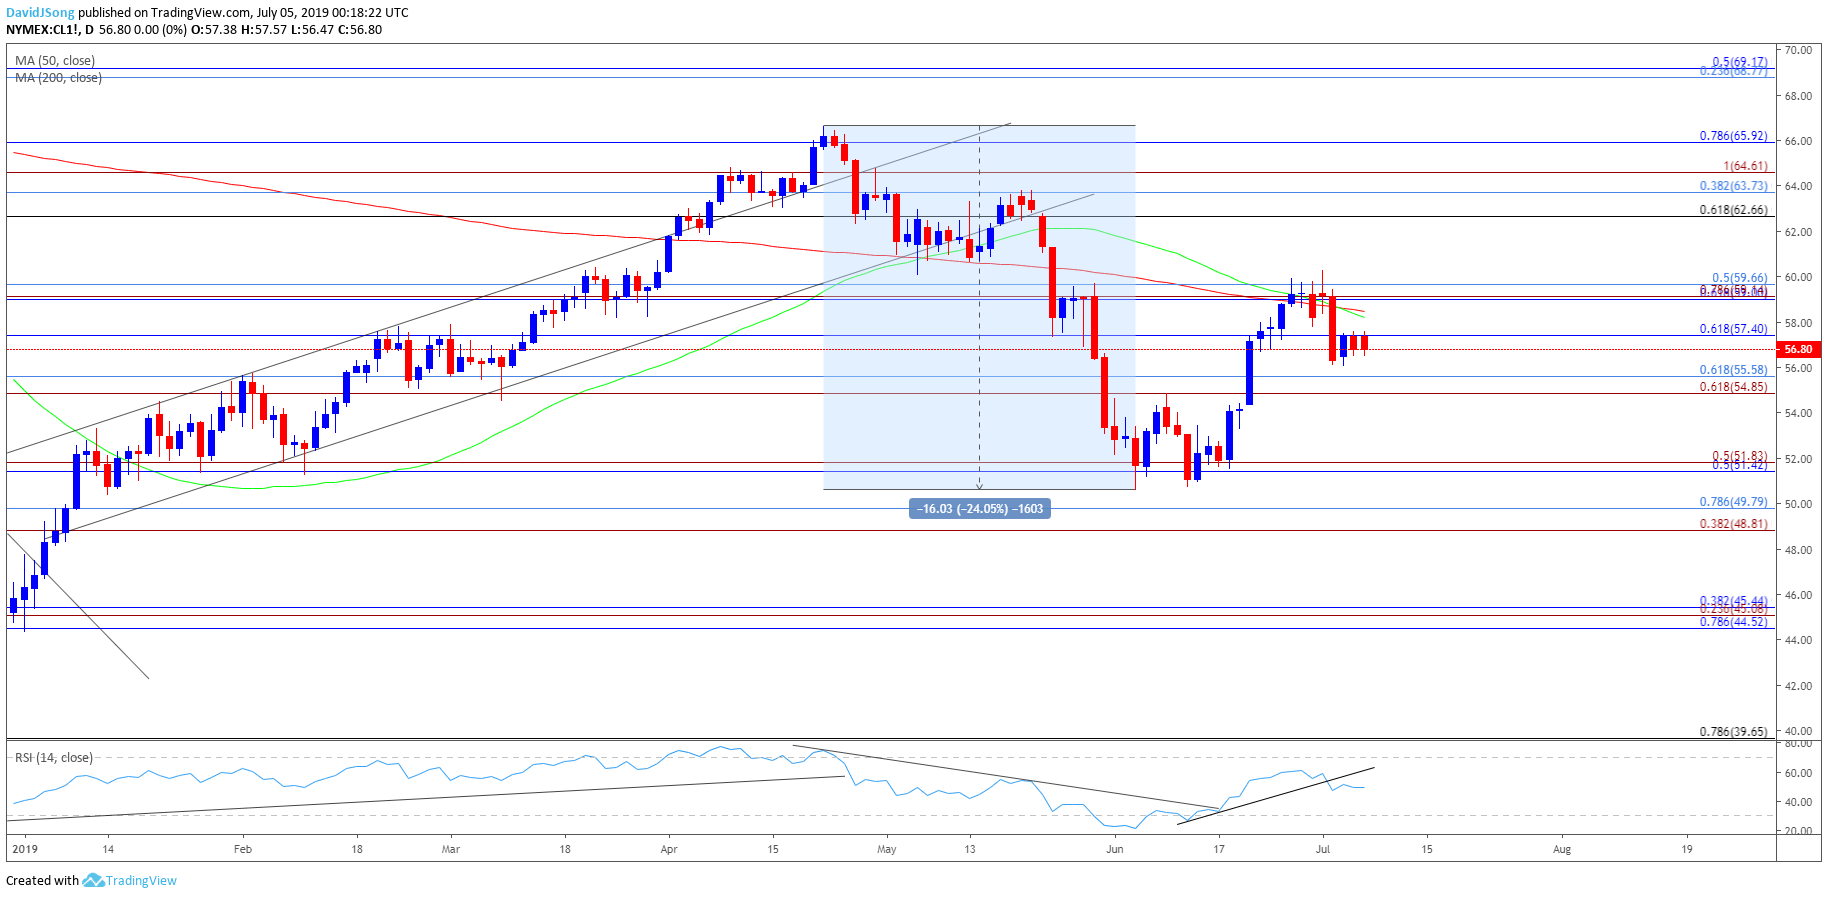
- Keep in mind, the broader outlook for crude oil is no longer constructive as both price and the Relative Strength Index (RSI) snap the bullish trends from earlier this year.
- At the same time, a ‘death cross’ formation has taken shape as the 50-Day SMA ($58.21) crosses below the 200-Day SMA ($58.48), with both moving averages tracking a negative slope.
- The string of failed attempts to close above the Fibonacci overlap around $59.00 (61.8% retracement) to $59.70 (50% retracement) has pushed crude prices back below the $57.40 (61.8% retracement) pivot, with the next area of interest coming in around $54.90 (61.8% expansion) to $55.60 (61.8% retracement).
- Next downside hurdle comes in around $51.40 (50% retracement) to $51.80 (50% expansion) followed by the overlap around $48.80 (38.2% expansion) to $49.80 (78.6% retracement).
- The RSI also offers a bearish signal as the oscillator snaps the upward trend carried over from the previous month.
Sign up and join DailyFX Currency Strategist David Song LIVE for an opportunity to discuss key themes and potential trade setups.
For more in-depth analysis, check out the 3Q 2019 Forecast for Oil
Additional Trading Resources
Are you looking to improve your trading approach? Review the ‘Traits of a Successful Trader’ series on how to effectively use leverage along with other best practices that any trader can follow.
Want to know what other markets the DailyFX team is watching? Download and review the Top Trading Opportunities for 2019.
--- Written by David Song, Currency Strategist
Follow me on Twitter at @DavidJSong.


