


Oil Talking Points
Oil prices trade near the monthly-high ($54.24) as the U.S. imposes sanctions against Petróleos de Venezuela, S.A. (PDV S.A.), and the recent developments keep the topside targets on the radar for crude as an inverse head-and-shoulders formation takes shape.
Oil Carves Inverse Head-and-Shoulders Despite Venezuela Sanction
The weakening outlook for supply is likely to spur a larger recovery in crude especially as Saudi Arabia Energy Minister Khalid Al-Falih pledges to reduce output ‘well below the voluntary cap’ during the proposed six-month period, and the ramped up efforts to stabilize the energy market is likely to keep crude prices afloat as ‘demand will start picking up at the end of the first quarter and into the second quarter.’
It seems as though the Organization of the Petroleum Exporting Countries (OPEC) and its allies will continue to take extraordinary measures to defend crude as Russia Minister of Energy, Alexander Novak ¸ endorses a price range of $55-65bbl, and the current environment raises the risk for a larger recovery as the advance from the 2018-low ($42.36) appears to be fueling the near-term shift in retail interest.
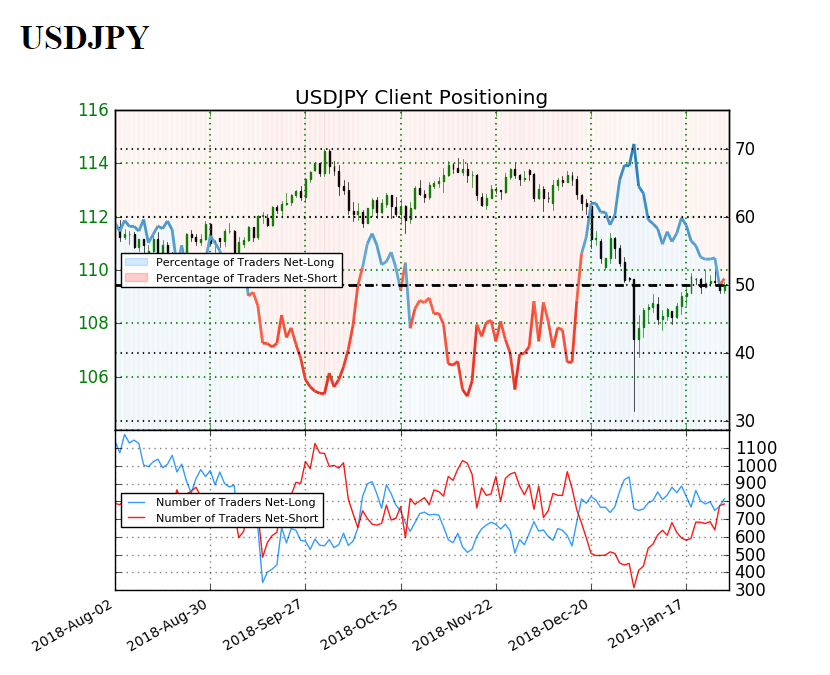
The IG Client Sentiment Report shows 59.5% of traders are now net-long crude compared to 67.7% on January 10, with the ratio of traders long to short at 1.47 to 1.Keep in mind, traders have been net-long since October 11 when oil traded near the $71.00 mark even though price remains 26.1% lower since then.The number of traders net-long is 15.3% lower than yesterday and 15.8% lower from last week, while the number of traders net-short is 37.9% higher than yesterday and 30.9% higher from last week.
Profit-taking behavior may account for the decline in net-long position, but the ongoing accumulation in net-short interest warns of a broader shift in market behavior even though oil breaks out of the downward trend from late-2018. In turn, a larger recovery may materialize as an inverse head-and-shoulders takes shape, with the Relative Strength Index (RSI) also providing a constructive outlook for crude as the oscillator extends the bullish formation from November. Sign up and join DailyFX Currency Analyst David Song LIVE for an opportunity to discuss potential trade setups.
Oil Daily Chart
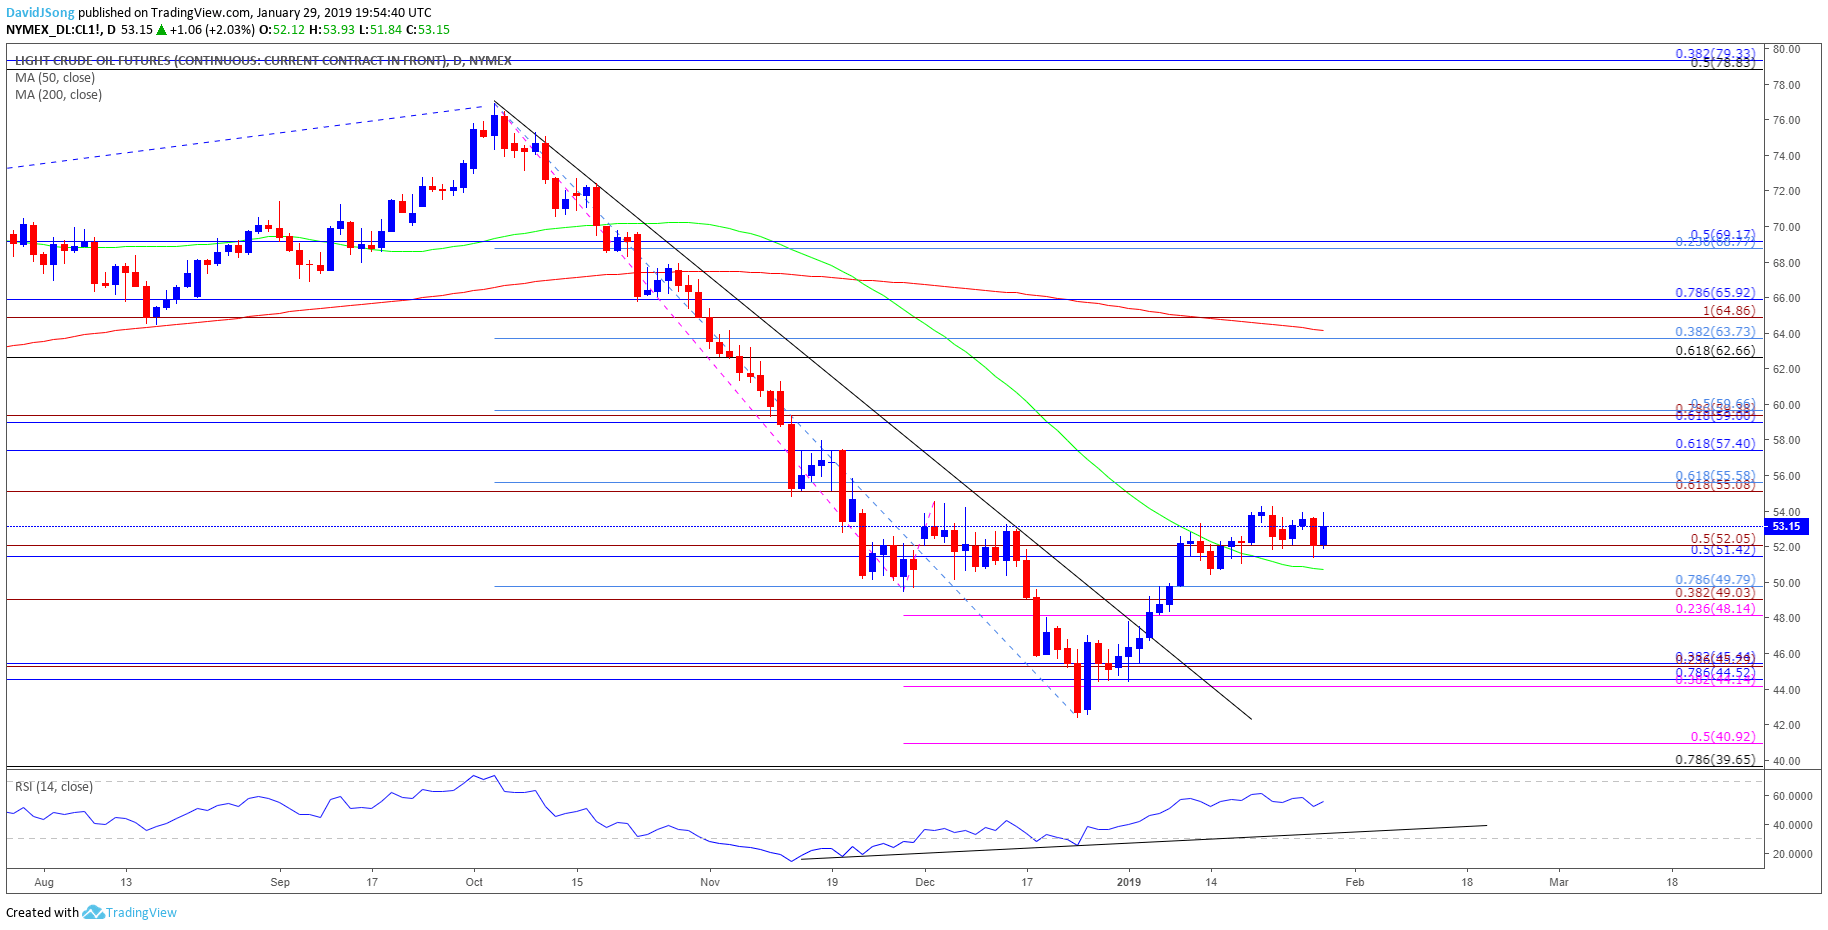
- Crude appears to be stuck in a narrow range following the failed attempt to test the December-high ($54.55), but the inverse head-and-shoulders formation raises the risk for a larger correction, with a break/close above the $55.10 (61.8% expansion) to $55.60 (61.8% retracement) region opening up the $57.40 (61.8% retracement) area.
- Next region of interest comes in around $59.00 (61.8% retracement) to $59.70 (50% retracement) followed by the Fibonacci overlap around $62.70 (61.8% retracement) to $63.70 (38.2% retracement).
For more in-depth analysis, check out the 1Q 2019 Forecast for Oil
Additional Trading Resources
Are you looking to improve your trading approach? Review the ‘Traits of a Successful Trader’ series on how to effectively use leverage along with other best practices that any trader can follow.
Want to know what other markets the DailyFX team is watching? Download and review the Top Trading Opportunities for 2019.
--- Written by David Song, Currency Analyst
Follow me on Twitter at @DavidJSong.


