


Oil Talking Points
Crude snaps back from a fresh yearly-low ($49.44) as Reuters reports that Russia and Saudi Arabia are in discussion to curb production, and recent developments may foster a larger rebound in oil prices as the Relative Strength Index (RSI) appears to be on the cusp of flashing a textbook buy-signal.
Oil Price Forecast: RSI on Cusp of Flashing Buy-Signal
It seems as though the Organization of the Petroleum Exporting Countries (OPEC) and its allies will make a major announcement at the next meeting on December 6 in response to the sharp selloff in crude oil prices, and the group may retain a proactive approach in rebalancing the energy market amid the weakening outlook for global demand.
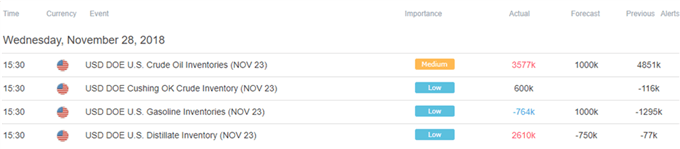
Fresh updates from the U.S. Energy Administration (EIA) showed crude inventories climbing another 3577K in week ending November 23 amid projections for a 1000K expansion, and oil remains vulnerable going into 2019 especially as the U.S. and China, the two largest consumers of crude, struggle to reach a trade agreement ahead of the Group of 20 (G20) Summit in Argentina.
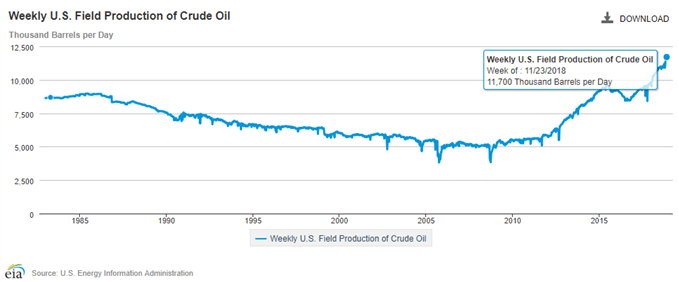
Keep in mind, non-OPEC production appears to be stalling as U.S. field production holds steady at 11,700K for the third consecutive week, and OPEC and its allies may try to avoid overemphasizing the recent volatility in oil prices as Kuwait’s Oil Minister, Bakheet Al-Rashidi, argues that ‘it’s very early to talk about any cuts.’ With that said, there is likely to be increased emphasis around the December meeting amid the mixed views coming out of OPEC, but the sentiment surrounding crude remains skewed as the retail crowd continues to bet on higher oil prices.
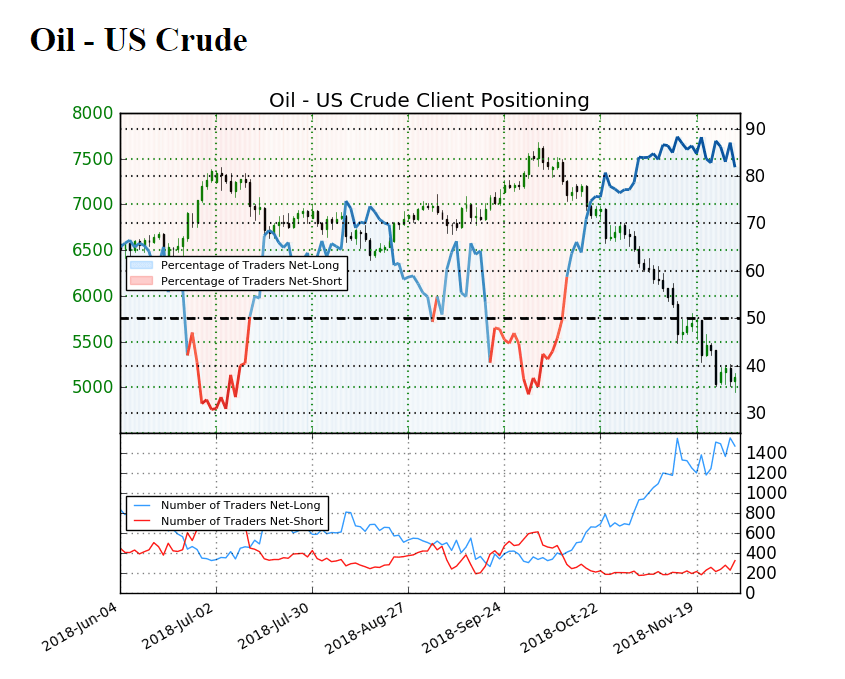
The IG Client Sentiment Report shows 81.9% of traders are still net-long crude compared 83.5% earlier this week, with the ratio of traders long to short at 4.51 to 1. In fact, traders have been net-long since October 11 when oil traded near the $71.00 mark even though price has moved31.4% lower since then. The number of traders net-long is 7.0% higher than yesterday and 20.1% higher from last week, while the number of traders net-short is 7.9% lower than yesterday and 20.7% higher from last week.
There appears to be growing interest in crude amid the pickup in both long and short interest, but the ongoing tilt in retail position provides a contrarian view to crowd sentiment as traders continue to bet on a near-term recovery. With that said, the broader outlook for oil remains tilted to the downside as it snaps the upward trend from earlier this year, but recent developments in the Relative Strength Index (RSI) warns of a change in the recent behavior as the oscillator bounces back from an extreme reading and appears to be diverging with price. Sign up and join DailyFX Currency Analyst David Song LIVE for an opportunity to discuss potential trade setups.
Oil Daily Chart
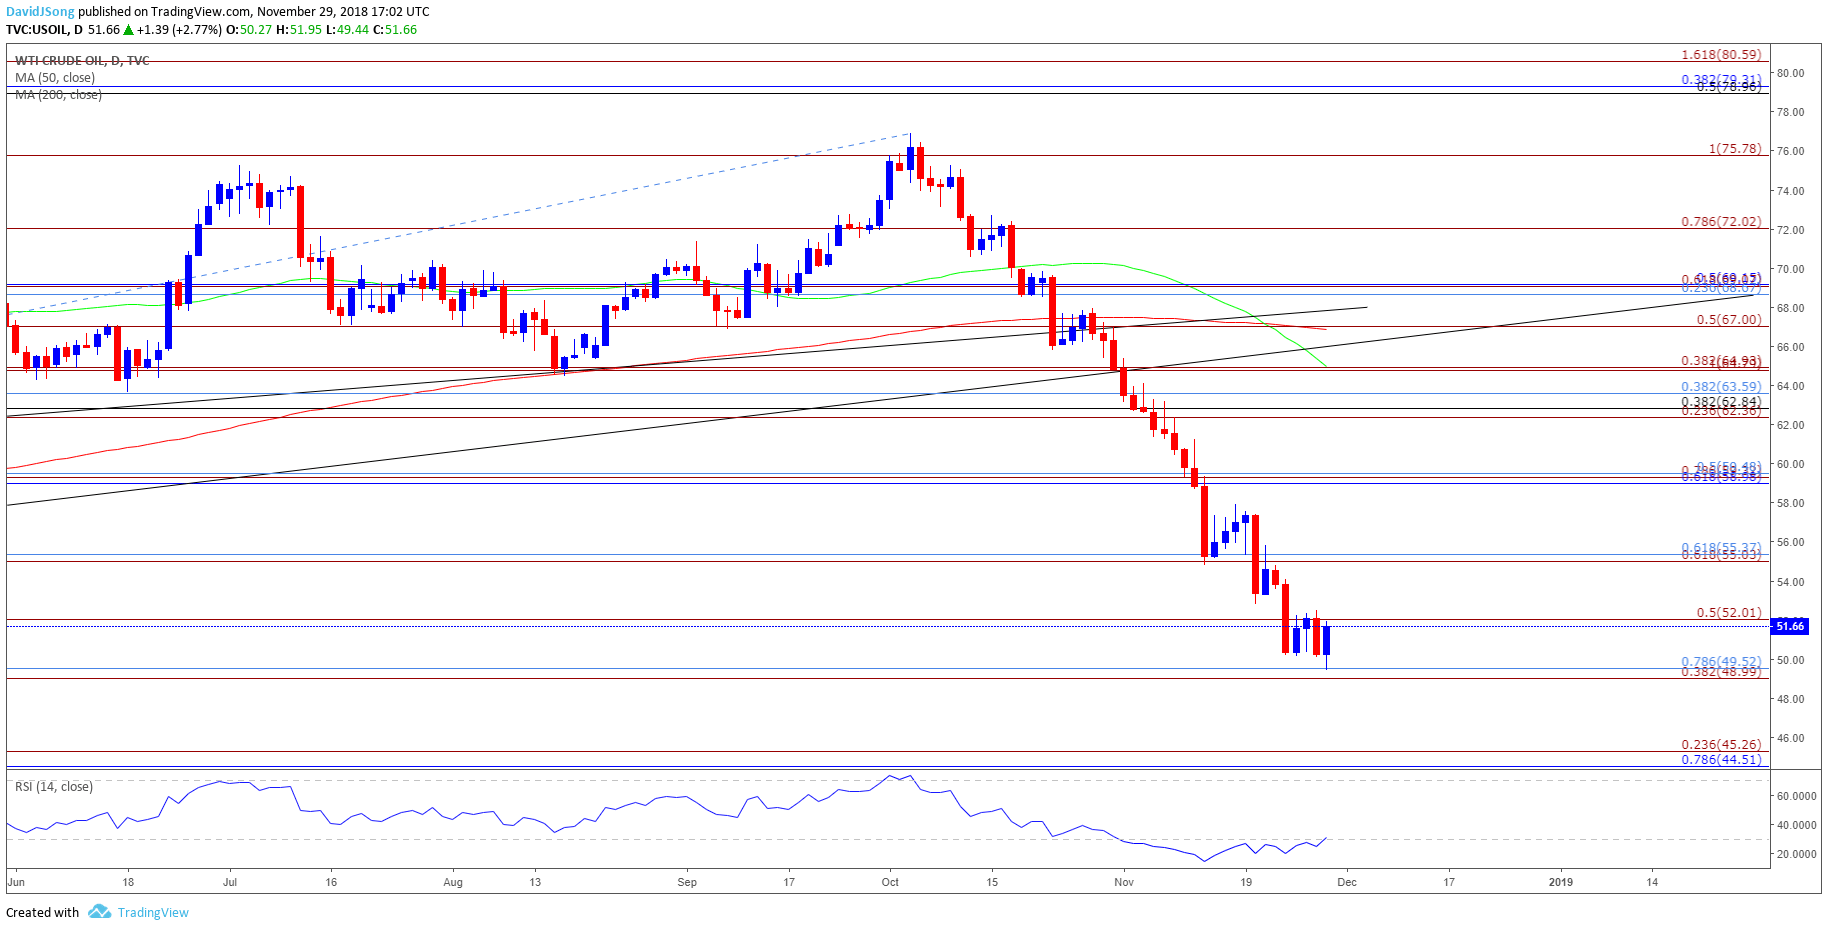
- Oil remains risk of extending the decline from earlier this month as long as the Relative Strength Index (RSI) sits in oversold territory, but the oscillator may flash a textbook buy signal over the coming days as it appears to be on the cusp of moving back above 30.
- Need a break/close below the Fibonacci overlap around $49.00 (38.2% expansion) to $49.50 (78.6% retracement) to open up the next downside target around $44.50 (78.6% retracement) to $45.30 (23.6% expansion).
- However, failure to clear the $49.00 (38.2% expansion) to $49.50 (78.6% retracement) region may generate a move back above the$52.00 (50% expansion) handle, with the next region of interest coming in around $55.00 (61.8% expansion) to $55.40 (61.8% retracement).
For more in-depth analysis, check out the Q4 Forecast for Oil
Additional Trading Resources
Are you looking to improve your trading approach? Review the ‘Traits of a Successful Trader’ series on how to effectively use leverage along with other best practices that any trader can follow.
Want to know what other currency pairs the DailyFX team is watching? Download and review the Top Trading Opportunities for 2018.
--- Written by David Song, Currency Analyst
Follow me on Twitter at @DavidJSong.


