


Gold Talking Points
The recent rebound in gold appears to be have stalled going into the U.S. mid-term election as the precious metal holds a narrow range, but there appears to be a more dynamic shift in market sentiment as the stickiness in the price for bullion spurs a jump in net-short retail interest.

Sticky Gold Prices Met With Jump in Net-Short Interest
The current environment may continue to produce range-bound conditions as the CFTC Commitments of Traders (CoT) report shows the 52-week historical volatility sitting at the lowest levels since the 1990s, and the Federal Reserve interest rate decision on November 8 may do little to shake up gold prices as the central bank is widely expected to keep the benchmark interest rate in its current range of 2.25% to 2.50%.
In turn, more of the same from Federal Open Market Committee (FOMC) may generate a limited reaction, with gold at risk of facing range-bound conditions, but the Fed’s hiking-cycle may continue to hamper the long-term outlook for gold as Chairman Jerome Powell & Co. appear to be on track to implement higher interest rates over the coming months.
At the same time, bullion appears to be moving to the beat of its own drum as silver stubbornly tracks the monthly open range for October, and a broader shift in market behavior looks to be taking shape as retail traders fade the stickiness in gold prices.
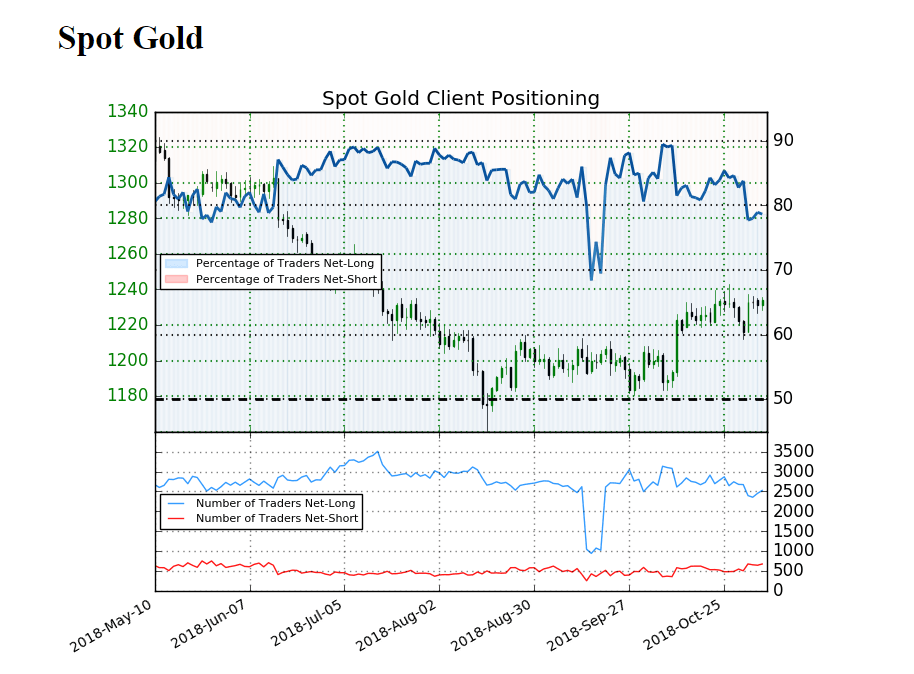
The IG Client Sentiment Report shows 78.7% of traders are still net-long gold as the ratio of traders long to short sits at 3.69 to 1, with the number of traders net-long 4.5% higher than yesterday and 7.8% lower from last week. However, the number of traders net-short is 0.6% lower than yesterday but stands 29.7% higher from last week.
With that said, the ongoing tilt in retail position undermines the recent strength in gold as it offers a contrarian view to crowd sentiment, but a further pickup in net-shorts may generate a potential shift in the IG Client Sentiment index as retail traders appear to be fading the correction in gold. Sign up and join DailyFX Currency Analyst David Song LIVE for an opportunity to discuss potential trade setups.
Gold Daily Chart
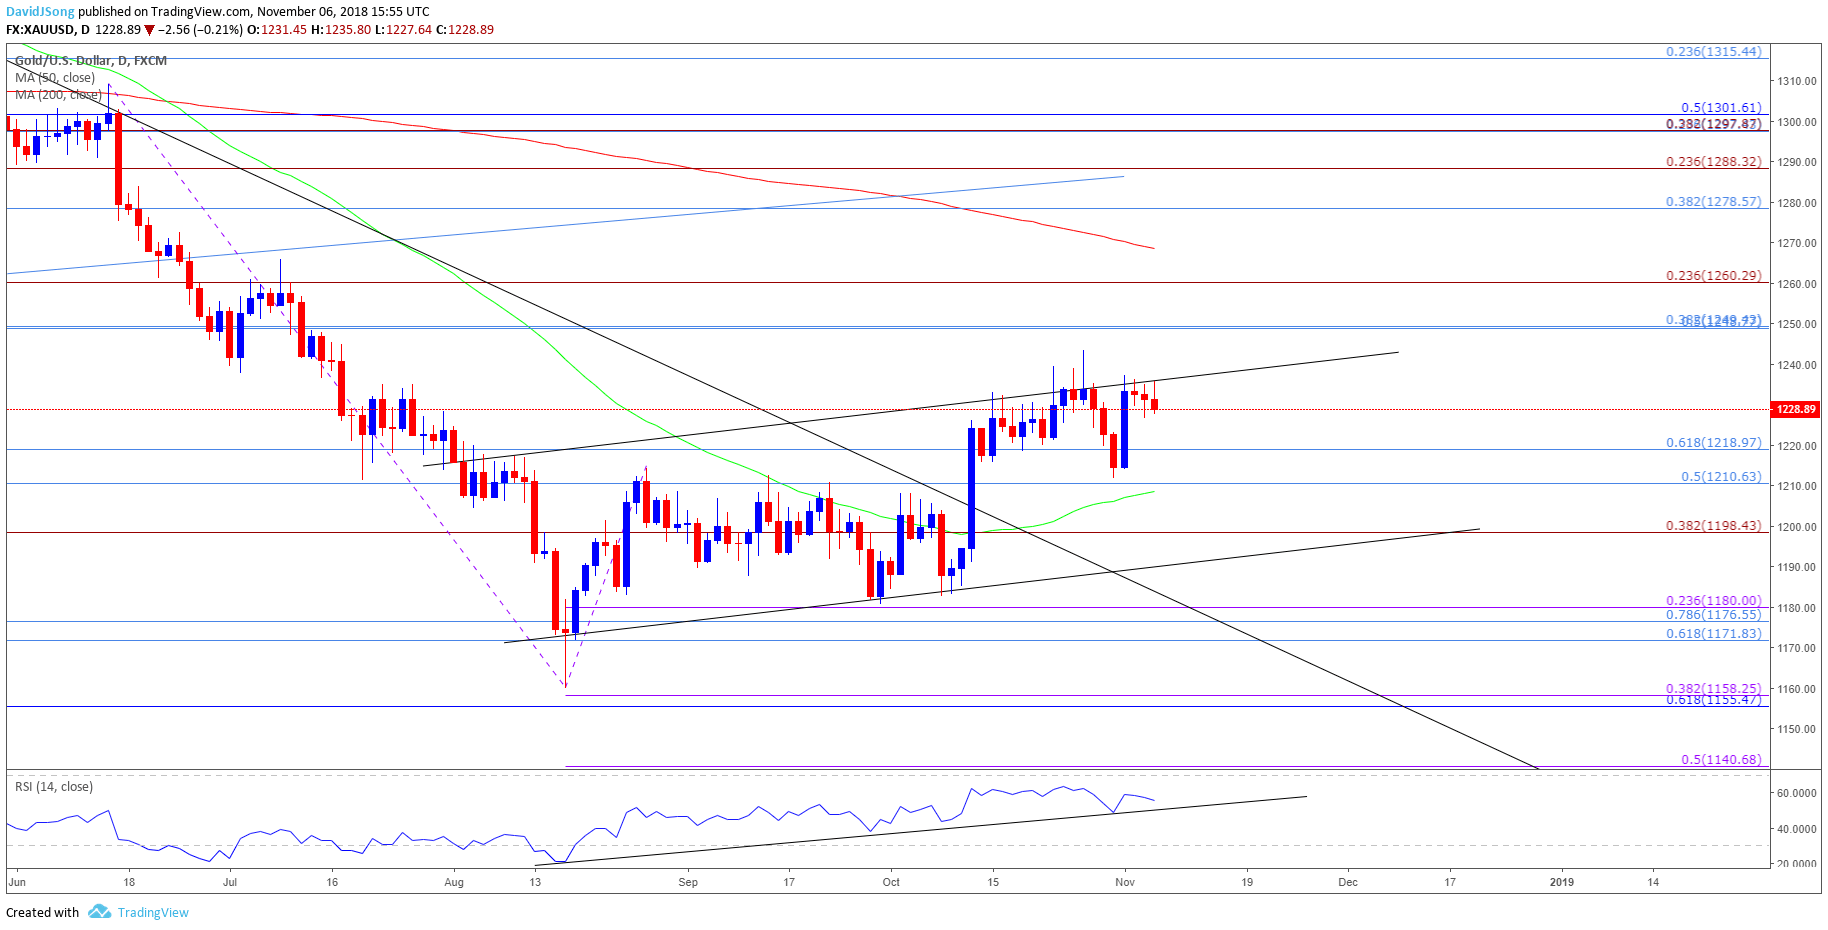
- Keep in mind, the broader outlook for gold is no longer bearish as it breaks out of the downward trend from earlier this year, with the topside target still on the radar as long as gold holds above the former-resistance zone around $1210 (50% retracement) to $1219 (61.8% retracement).
- The Fibonacci overlap around $1249 (50% retracement) to $1250 (38.2% retracement) comes up first, with the next region of interest coming in around $1260 (23.6% retracement) followed by the $1279 (38.2% retracement).
For more in-depth analysis, check out the Q4 Forecast for Gold
Additional Trading Resources
Are you looking to improve your trading approach? Review the ‘Traits of a Successful Trader’ series on how to effectively use leverage along with other best practices that any trader can follow.
Want to know what other markets the DailyFX team is watching? Download and review the Top Trading Opportunities for 2018.
--- Written by David Song, Currency Analyst
Follow me on Twitter at @DavidJSong.


