


Oil Talking Points
Oil prices remain bid as fresh updates from the U.S. Department of Energy showed a marked decline in crude inventories, with crude at risk of extending the recent series of higher highs & lows as the bullish momentum appears to be gathering pace.
Oil Prices Risk Larger Rally as Bullish Momentum Gathers Pace
The reaction to the Organization of the Petroleum Exporting Countries’ (OPEC) 174th meeting keeps the near-term outlook for crude tilted to the topside as oil breaks out of a narrow range, and the 9891K contraction in U.S. oil inventories may keep energy prices afloat as it curbs the outlook for supply.
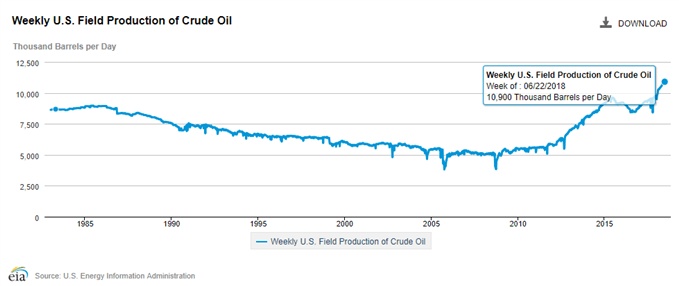
At the same time, the updates showed weekly U.S. field outputs holding steady at 10,900K b/d for the third consecutive week for the period ending June 22, and the recent developments may foster higher oil prices over the near-term especially as OPEC and its allies remain in no rush to restore production.
With that said, recent price action raises the risk for a further advance in oil prices as it continues to carve a series of higher highs & lows, while the Relative Strength Index (RSI) flirts with overbought territory.
Oil Daily Chart
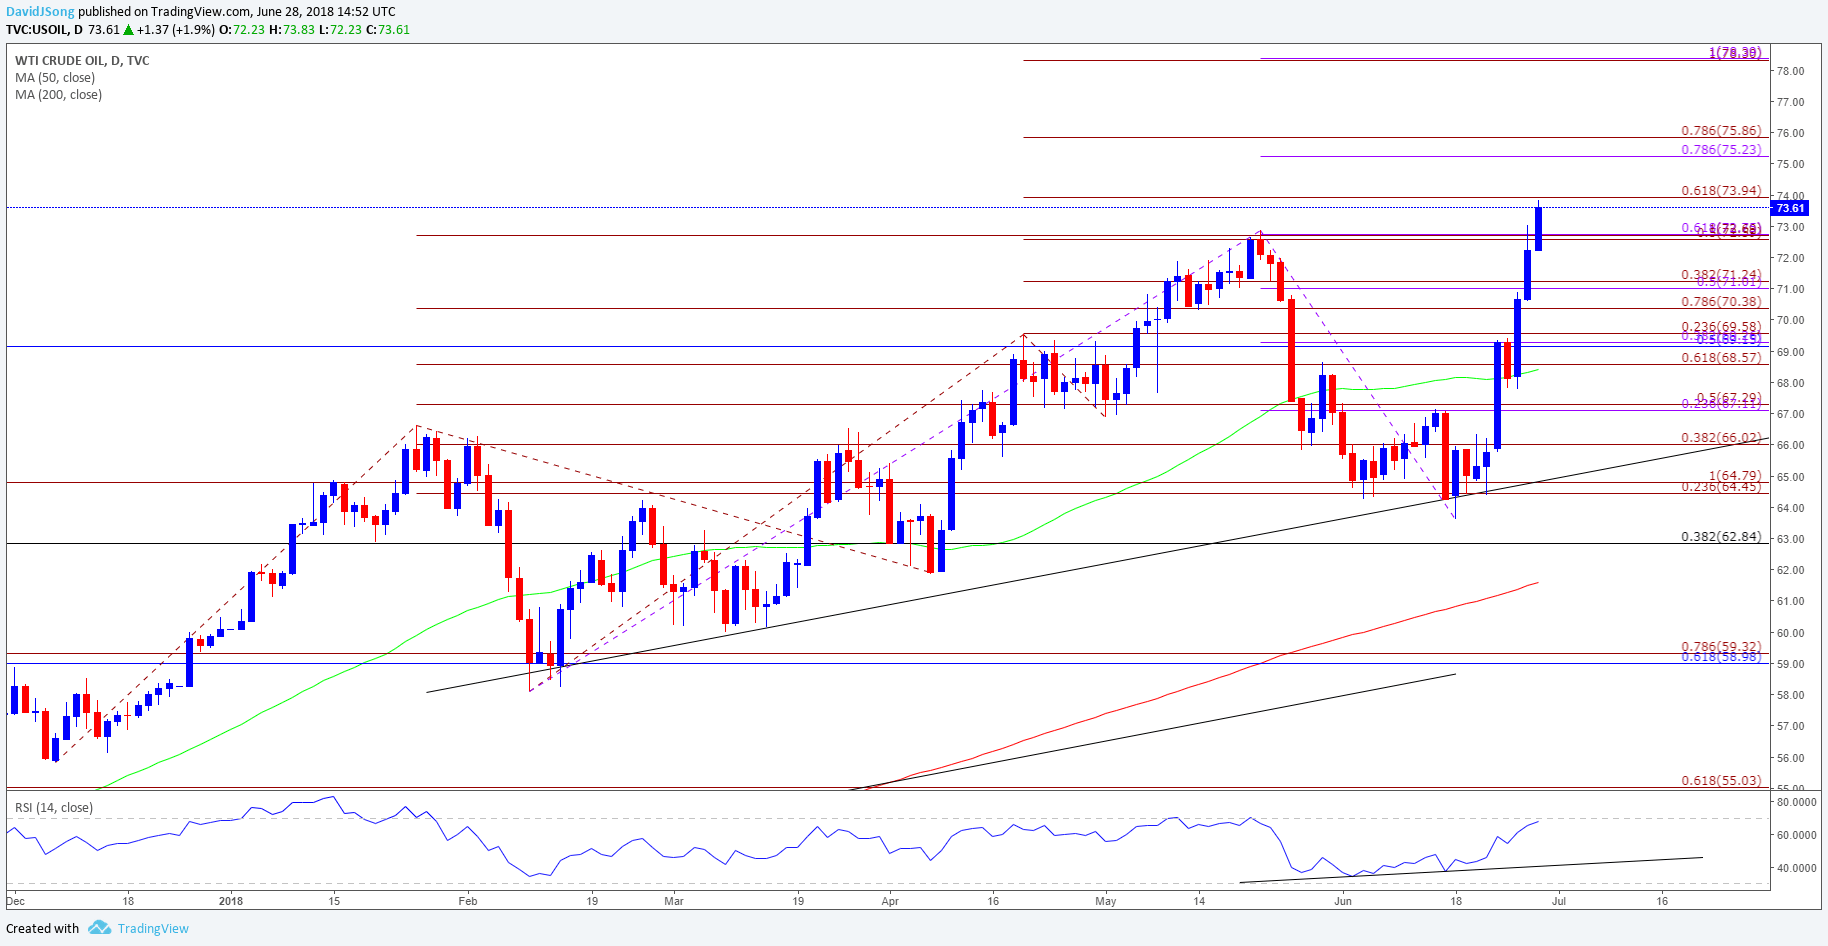
- Topside targets remain on the radar for oil following the breakout, with a break/close above the $74.00 (61.8% expansion) handle raising the risk for a run at the Fibonacci overlap around $75.20 (78.6% expansion) to $75.90 (78.6% expansion).
- Next region of interest comes in around $78.30 (100% expansion) to $78.40 (100% expansion), but need to close a close eye on the RSI as it comes up against overbought territory, with a failed attempt to break above 70 raising the risk for a pullback in the exchange rate.
For more in-depth analysis, check out the Q2 Forecast for Oil
Interested in having a broader discussion on current market themes? Sign up and join DailyFX Currency Analyst David Song LIVE for an opportunity to discuss potential trade setups!
Additional Trading Resources
Are you looking to improve your trading approach? Review the ‘Traits of a Successful Trader’ series on how to effectively use leverage along with other best practices that any trader can follow.
Want to know what other currency pairs the DailyFX team is watching? Download and review the Top Trading Opportunities for 2018.
--- Written by David Song, Currency Analyst
Follow me on Twitter at @DavidJSong.


