


Oil Talking Points
Oil prices are under pressure even as Iraq Oil Minister, Jabbar al-Luaibi, argues that the Organization of the Petroleum Exporting Countries (OPEC) and its allies have yet to meet the production-cutting quotas laid out in 2017, and recent price action raises the risk for a further decline in crude as it initiates a fresh series of lower highs & lows.
Oil Price Forecast: Range at Risk as Bearish Series Takes Shape
Crude appears to be stuck in a narrow range as market participants eagerly wait for the OPEC meeting on June 22, and the extraordinary efforts to rebalance the energy market may keep oil prices afloat as the group & its allies pledge to reduce output throughout 2018.
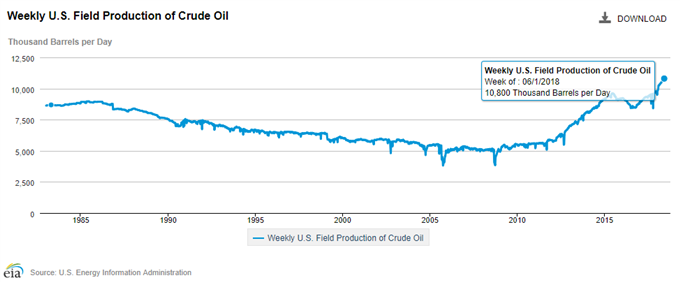
In turn, more of the same from OPEC may prop up crude prices especially as officials in Saudi Arabia look for $80/bbl, and the ongoing expansion in shale production may require OPEC & its allies to carry the production-cutting quotas into 2019as U.S. field output climbs to record highs.
However, a material change in the output schedule may generate headwinds for crude especially as drillers in Russia stand ready to ramp up production, and oil stand at risk of facing a more bearish fate over the summer months as the Trump Administration shows a growing interest to curb energy prices. As a result, crude remains vulnerable to further losses, with oil prices at risk of giving back the advance from the 2018-low ($58.11) as both price and the Relative Strength Index (RSI) snap the bullish formations from earlier this year.
Oil Daily Chart
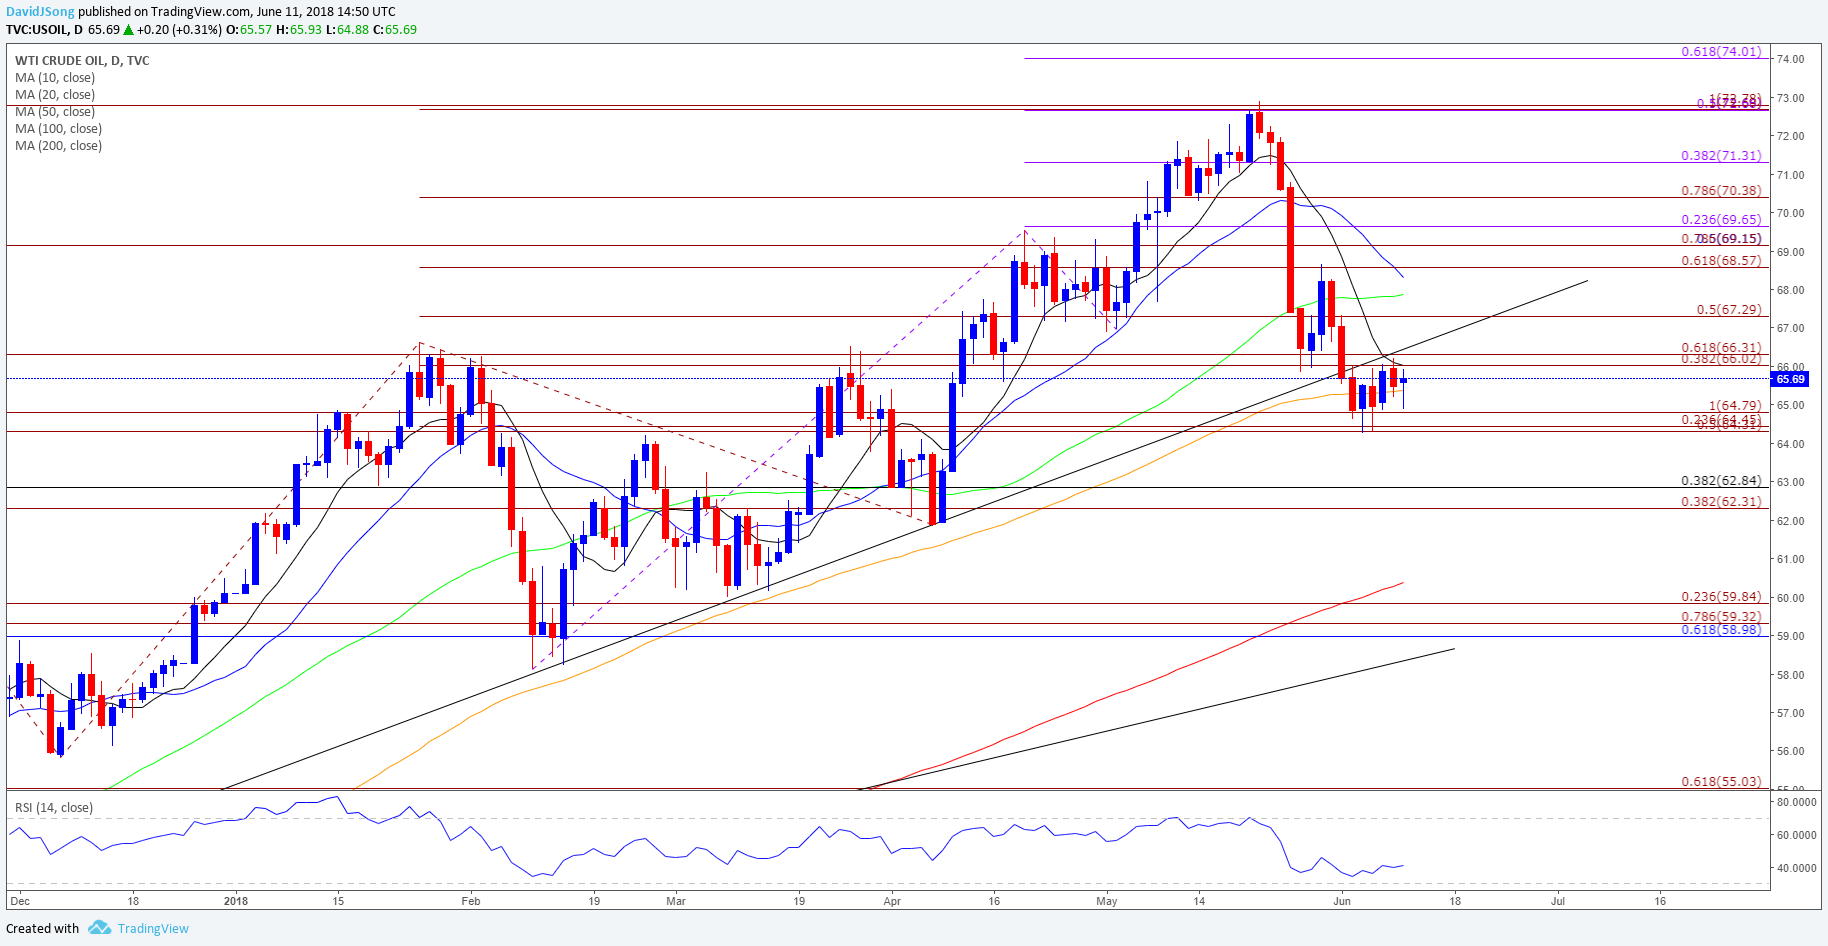
- The string of failed attempts to push back above the $66.00 (38.2% expansion) to $66.30 (61.8% expansion) region may keep oil prices under pressure, but need to see a break/close below the $64.30 (50% expansion) to $64.80 (100% expansion) zone to favor a larger correction.
- Next downside region of interest comes in around $62.30 (38.2% expansion) to $62.80 (38.2% retracement), which sits just above the April-low ($61.84), followed by the Fibonacci overlap around $59.00 (61.8% retracement) to $59.80 (23.6% expansion).
For more in-depth analysis, check out the Q2 Forecast for Oil
Interested in having a broader discussion on current market themes? Sign up and join DailyFX Currency Analyst David Song LIVE for an opportunity to discuss potential trade setups!
Additional Trading Resources
Are you looking to improve your trading approach? Review the ‘Traits of a Successful Trader’ series on how to effectively use leverage along with other best practices that any trader can follow.
Want to know what other currency pairs the DailyFX team is watching? Download and review the Top Trading Opportunities for 2018.
--- Written by David Song, Currency Analyst
Follow me on Twitter at @DavidJSong.


