


Oil Talking Points
Crude may face range bound conditions ahead of the Organization of the Petroleum Exporting Countries’ (OPEC) meeting on June 22 as it snaps the recent string of lower highs & lows, but the broader outlook highlight the risk for lower energy prices as oil fails to retain the bullish trend carried over from the previous year.
Oil Prices to Succumb to Rising U.S. Output, Increased OPEC Supply
Crude stand at risk of facing a more bearish fate over the summer months as the Trump Administration shows a growing interest to curb energy prices, and OPEC appears to be on track to discuss a potential adjustment at the upcoming meeting on June 22 as its production-cutting efforts come under increased scrutiny.
Even though OPEC and its allies remain committed to rebalancing the energy market, a material change in the production schedule is likely to impact oil prices as U.S. firms continue to ramp up supply.
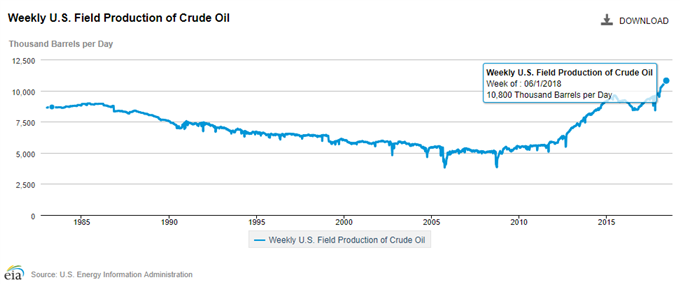
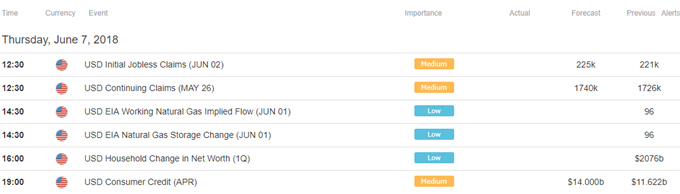
Updated figures from the U.S. Energy Information Administration (EIA) showed the 2072K rise in crude inventories was accompanied by a 0.3% pickup in field outputs, and the ongoing expansion in shale production may help to fuel the recent weakness in oil prices especially if OPEC and its allies look to boost their capacity over the months ahead.
As a result, it may only be a matter of time before crude succumbs to a larger correction, with oil prices at risk of giving back the advance from the 2018-low ($58.11) as both price and the Relative Strength Index (RSI) snap the bullish formations from earlier this year.
Oil Daily Chart
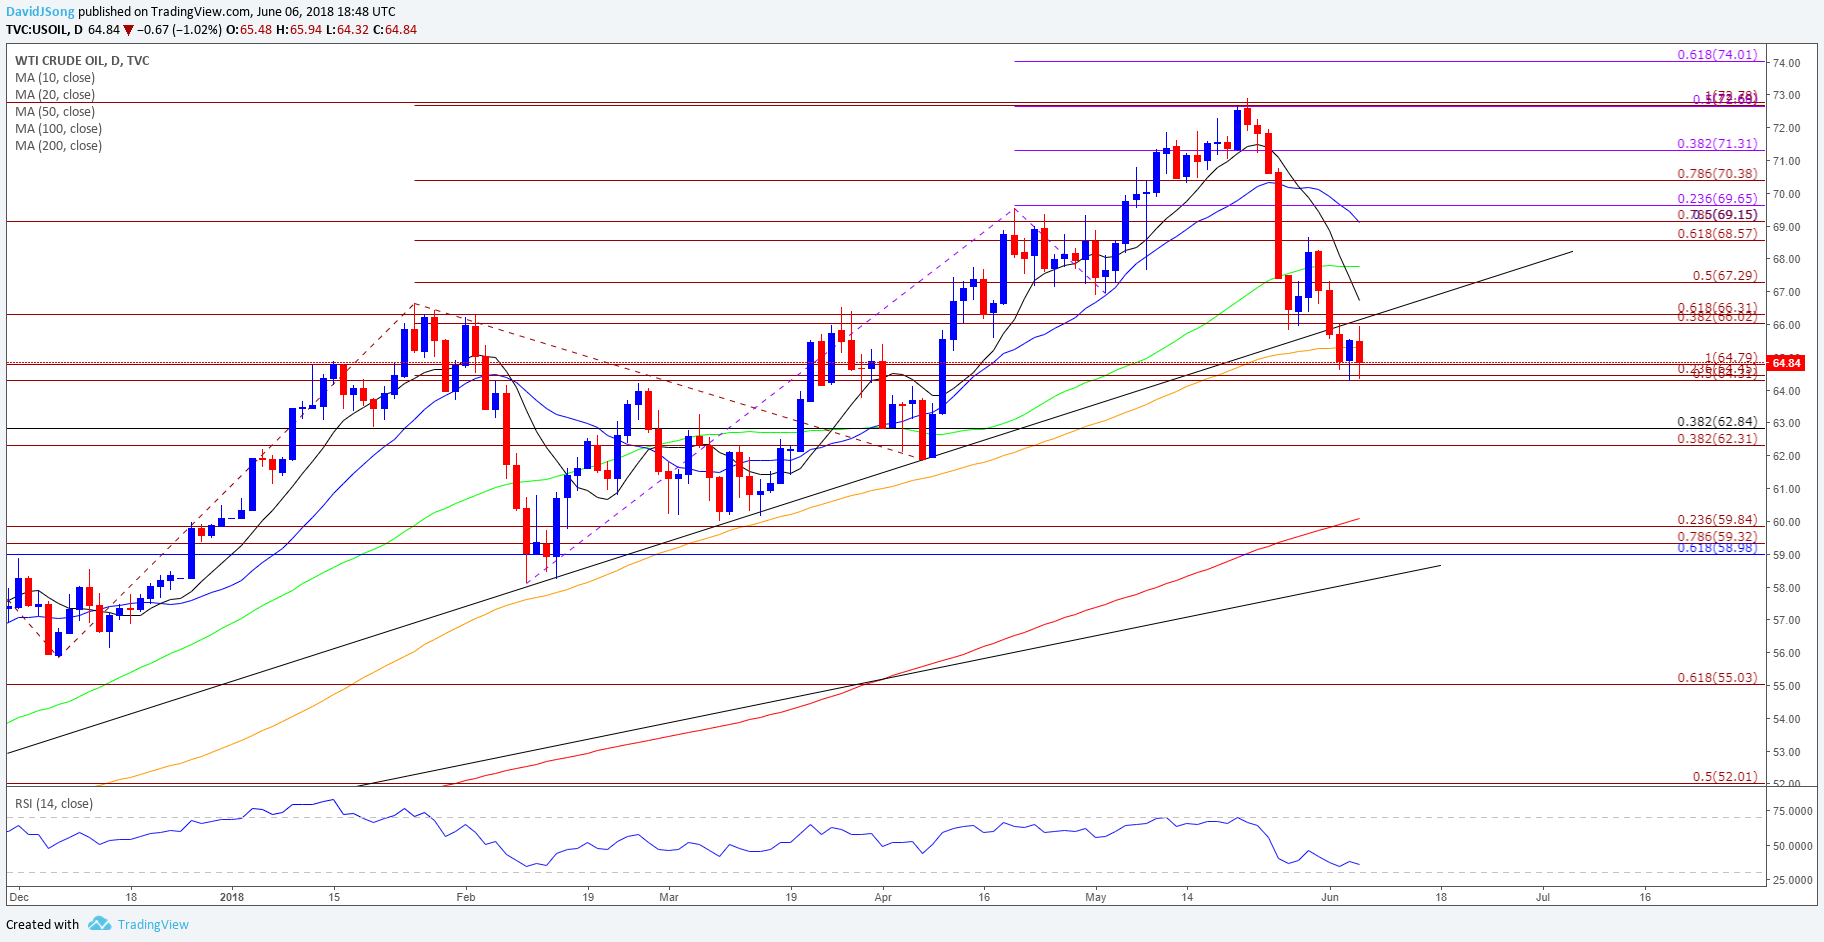
- Oil appears to be stuck in a narrow range, but lack of momentum to push back above the $66.00 (38.2% expansion) to $66.30 (61.8% expansion) region raises the risk for further losses especially as the Relative Strength Index (RSI) gradually works its way towards oversold territory.
- Still waiting for a break/close below the $64.30 (50% expansion) to $64.80 (100% expansion) region to open up the next downside area of interest around $62.30 (38.2% expansion) to $62.80 (38.2% retracement), which sits just above the April-low ($61.84).
For more in-depth analysis, check out the Q2 Forecast for Oil
Interested in having a broader discussion on current market themes? Sign up and join DailyFX Currency Analyst David Song LIVE for an opportunity to discuss potential trade setups!
Additional Trading Resources
Are you looking to improve your trading approach? Review the ‘Traits of a Successful Trader’ series on how to effectively use leverage along with other best practices that any trader can follow.
Want to know what other currency pairs the DailyFX team is watching? Download and review the Top Trading Opportunities for 2018.
--- Written by David Song, Currency Analyst
Follow me on Twitter at @DavidJSong.


