


OIL TALKING POINTS
Crude stands at risk of extending the decline from the previous month as a fresh bearish sequence starts to take shape, but ongoing efforts by the Organization of the Petroleum Exporting Countries (OPEC) and its allies to rebalance the energy market may keep oil prices afloat as Russia Energy Minister Alexander Novak pledges that the group remains ‘fully committed’ in fulfilling their production-cutting measures.
OIL PRICES CARVE BEARISH SERIES, SNAPS 100-DAY SMA AHEAD OF OPEC MEETING
The upcoming OPEC meeting on June 22 is likely to influence the near-term outlook for crude as the group keeps the door open to carry the coordinated efforts into 2019.
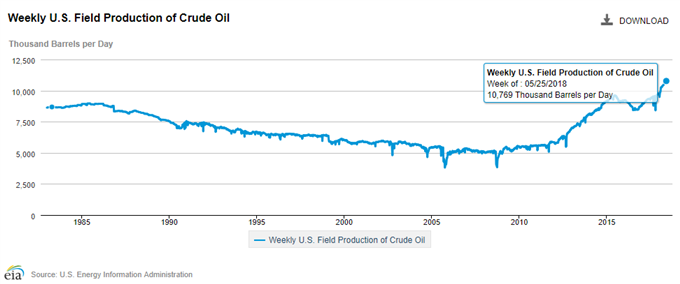
Even though oil producers in Russia stand ready to boost production, record field output in the U.S. may continue to embolden the alliance with OPEC especially as Venezuela President Nicolas Maduro looks to boost output by 1 million b/d. In response, OPEC & Russia may largely retain their proactive approach to foster higher oil prices, but recent price action raises the risk for a larger correction in crude as oil prices snaps the 100-Day ($65.30) simple-moving average (SMA) for the first time since September.
As a result, oil prices may continue to track lower ahead of the OPEC meeting, with crude facing a growing risk of giving back the advance from the 2018-low ($58.11) as both price and the Relative Strength Index (RSI) snap the bullish formations from earlier this year.
OIL DAILY CHART
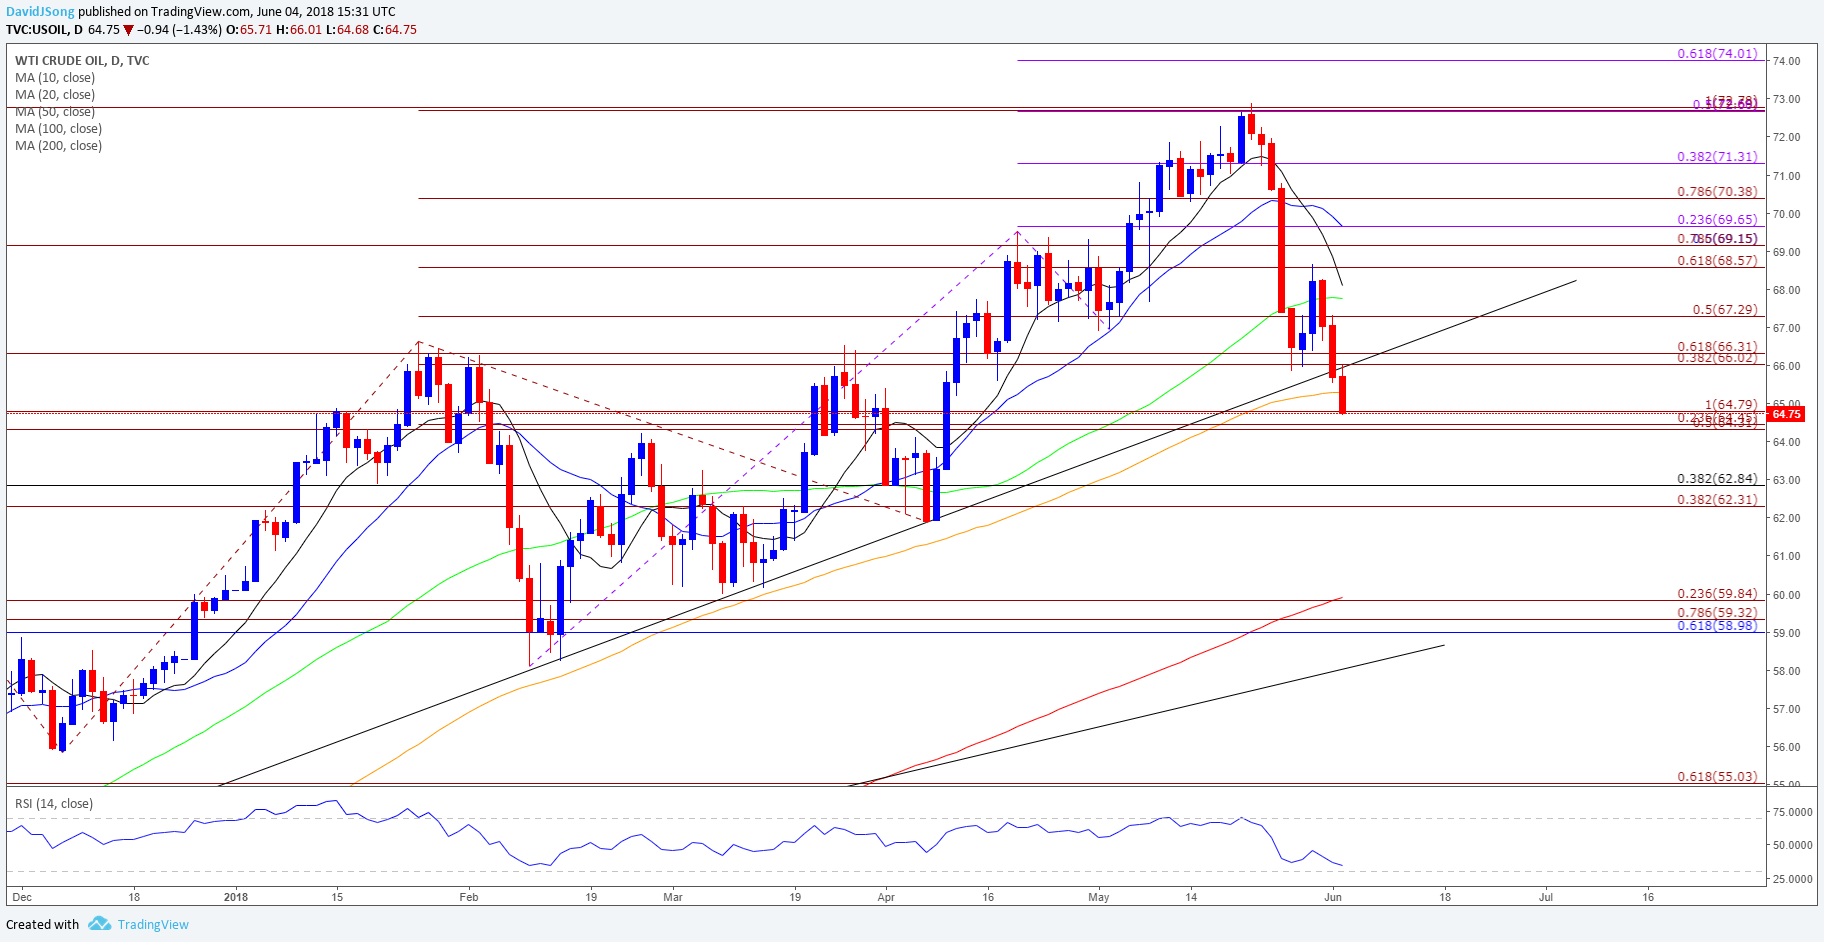
- The break of trendline support raises the risk for a further decline in oil prices, with the downside targets still on the radar as crude carves a fresh series of lower highs & lows.
- Need a break/close below the $64.30 (50% expansion) to $64.80 (100% expansion) region to open up the next downside area of interest around $62.30 (38.2% expansion) to $62.80 (38.2% retracement), which sits just above the April-low ($61.84).
For more in-depth analysis, check out the Q2 Forecast for Oil
Interested in having a broader discussion on current market themes? Sign up and join DailyFX Currency Analyst David Song LIVE for an opportunity to discuss potential trade setups!
ADDITIONAL TRADING RESOURCES
Are you looking to improve your trading approach? Review the ‘Traits of a Successful Trader’ series on how to effectively use leverage along with other best practices that any trader can follow.
Want to know what other currency pairs the DailyFX team is watching? Download and review the Top Trading Opportunities for 2018.
--- Written by David Song, Currency Analyst
Follow me on Twitter at @DavidJSong.


